2025 · Research研究 · Schneider Electric · Under NDA保密协议
Reference-Free Nominal Voltage Estimation from Smart-Meter Data不依赖参考值,从智能电表数据估算额定电压
This research finds the nominal voltage of each smart-meter signal, meaning the voltage its circuit is designed to run at, using only the meter readings and no lookup table of standard values. Meters only collect signals and don't report the nominal voltage, but power-quality analysis needs it as a baseline. The proposed pipeline finds each signal's nominal voltage from raw meter data after removing unsteady, unbalanced and inconsistent signals. It was tested on 151,033 signals from 192 U.S. corporations and reached 99.995% accuracy on the 132,790 signals that passed screening. The main contribution of this research is finding the nominal voltage without relying on predefined references. The nominal voltage is also estimated from local data, so it reflects each site's own conditions and makes it possible to follow local behavior and how it changes over time.这项研究只用电表读数,不借助标准电压对照表,找出每个智能电表信号的额定电压,也就是它所在电路设计时的运行电压。电表只采集信号,不会报告额定电压,但电能质量分析需要以它为基准。所提出的流程先剔除不稳定、不平衡和不一致的信号,再从原始电表数据中求出每个信号的额定电压。它在来自 192 家美国企业的 151,033 个信号上做了测试,在通过筛查的 132,790 个信号上达到了 99.995% 的准确率。这项研究的主要贡献,是在不依赖预设参考值的情况下求出额定电压。额定电压还是根据本地数据估算的,因此能反映每个站点自身的情况,也让跟踪本地的运行状况及其随时间的变化成为可能。
- Signals evaluated评估的信号数
- 151,033151,033
- Agreement on the signals that passed screening通过筛查的信号上的一致率
- 99.995%99.995%
- Doubtful signals sent to review instead of guessed送去人工复核、而不是靠猜的可疑信号
- 18,24318,243
The problem
Every power-quality question — is this voltage too high, too low, drifting — is asked relative to a circuit’s nominal voltage: the value it is designed to run at. Smart meters (AMI) do not report it. What they report is a reading every 1 to 60 minutes, per phase, per transformer.
The usual workaround takes each signal’s average and snaps it to the nearest value in a table of standard voltages — 120, 208, 240, 277, 480. That assumes the average means something. On multi-minute meter data it often does not. IEEE 1159 defines RMS and average quantities on waveform-resolution samples, not on readings minutes apart, and real meter feeds carry gaps, dropouts and spikes. A single reading near 30,000 V moves a monthly mean a long way.
The question from Schneider Electric: can the nominal voltage be found from the meter data alone, without being told which standard value to expect?
Not a lookup
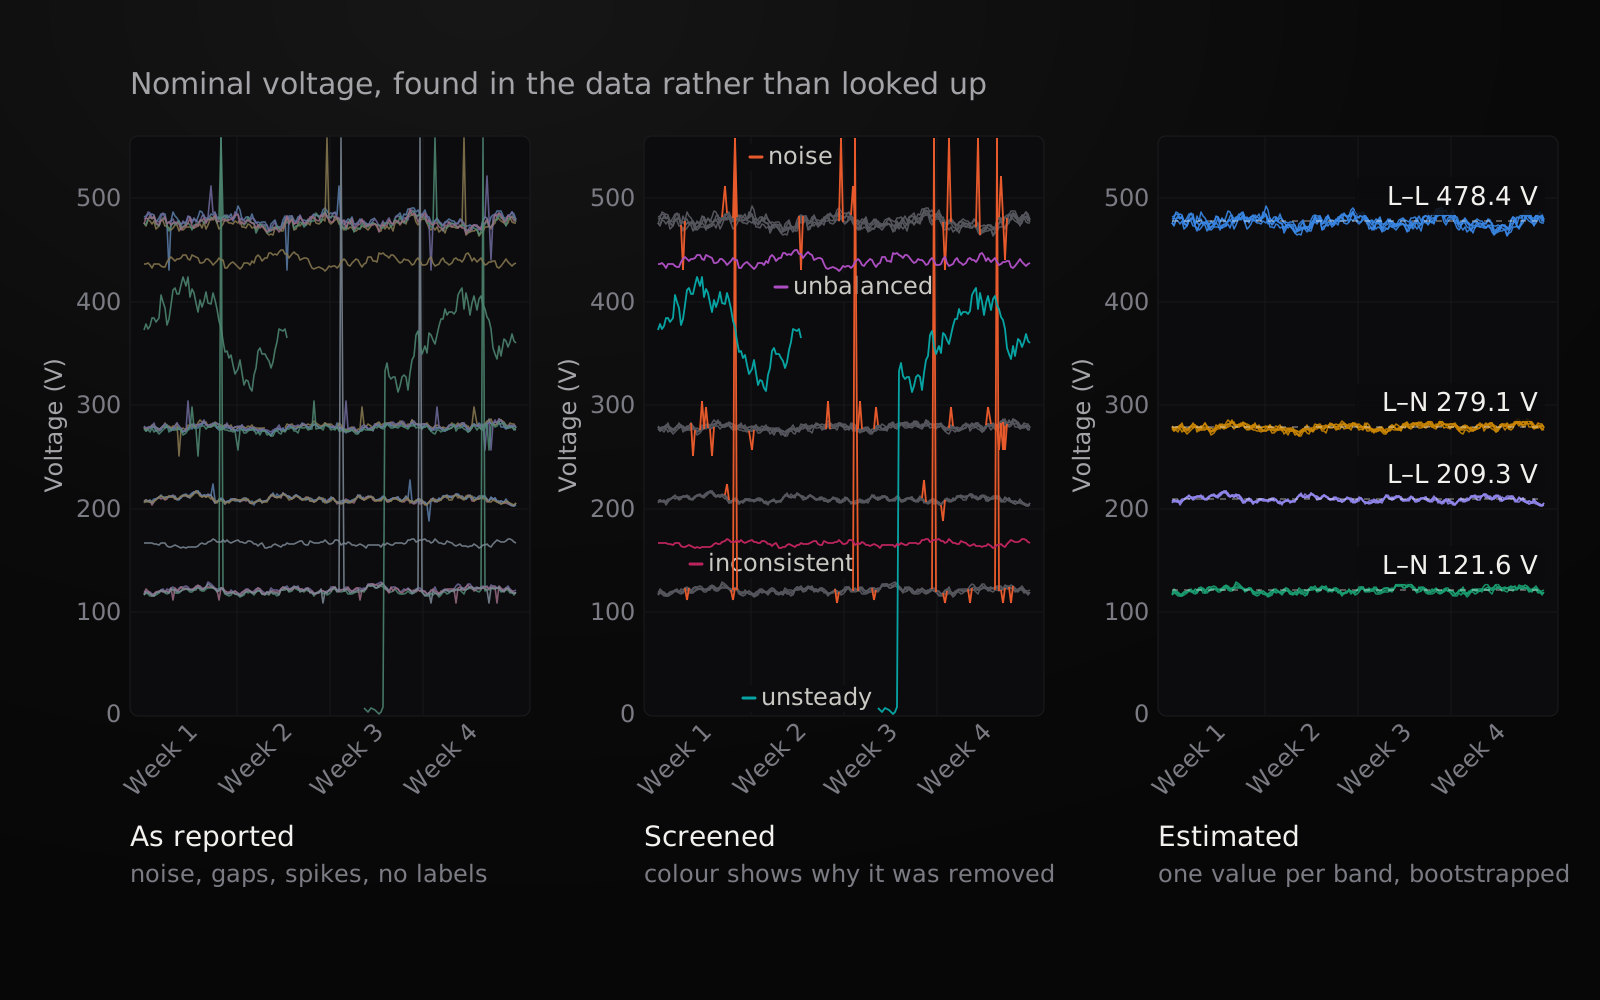
The method never consults the table of standard voltages. It leans on the standards for their rules — how far a healthy voltage may wander, what counts as unbalanced — but not for their values. Each band’s nominal voltage is estimated from its own readings, and comes out as what the site actually runs at: 478.4 V, not 480.
How it works
Steady signals first. Each signal gets a stable operating level: the median of a 1,000-resample bootstrap of its mean, which noise and outliers barely move. A signal counts as steady only if, in every seven-day window, at least 95% of its readings sit within ±5% of that level — the fluctuation IEEE 1159 expects around nominal. On a sample of 2,313 signals the 95th-percentile deviation was 4.4%, inside the limit. In steady signals, the few outliers are stripped and short gaps filled from the stable level. Signals that fail are not estimated at all.
Device-level screening. Each meter watches one transformer, so its phases have to agree. ANSI C84.1’s utilization range works out to roughly −10% to +5% of nominal, so no single band can span more than a max-to-min ratio of 1.05 / 0.90 = 1.1667. Phases of one device that break that ratio are band-inconsistent. Phases whose unbalance passes 5% are flagged as unbalanced — ANSI field surveys put normal systems under 3%, and more than 800 normally operating devices here peaked at 4.1%. Line-to-line and line-to-neutral readings are handled separately: on the same device they always sit in different bands.
Bands, per configuration. Meters are grouped by what they measure, and L–L and L–N signals are clustered apart, because their tolerance windows overlap — a 240 V L–L band runs 216–252 V and a 277 V L–N band 249–291 V. Signals join a band by the same 1.1667 rule, and every finished band is checked against it once more; a band that fails goes to review rather than being trusted. Each corporation is processed on its own, because identical meter setups behave differently from one site to the next.
One value per band. The nominal voltage of each validated band is a bootstrap estimate over all of its readings.
Results
Evaluated on 151,033 signals from 192 U.S. corporations, against nominal labels assigned by hand by domain experts — treated as a baseline rather than ground truth, since people set them.
- 18,243 signals were sent to manual review rather than guessed. 16,170 failed the steadiness check — some held fewer than 50 readings across a month — and the average method put about 18% of those at roughly 0 V. Another 2,073 failed band consistency or unbalance, and for more than half of them the average method assigned the wrong nominal, in one case splitting the three phases of a single device across different standard voltages.
- On the 132,790 signals that passed, agreement was 99.995%, against 99.868% for the average method. On clean data the gap is small, and that is not where the value lies: the average method has no way to say I don’t know. This one does.
- It reports the local operating value — 478.44 V or 472.95 V over a given window — rather than a fixed reference, which is what drift and power-quality analysis downstream actually needs.
- It handles 4 to 8 signals a second over a month of data. That is slower than averaging, so it is built for post-processing rather than real-time monitoring.
Where it breaks
A group-level anomaly fools it. If every phase of a faulty device is wrong together, the group is internally consistent, passes screening, and becomes a band of its own — one corporation produced a band at 153.5 V, which matches no standard voltage at all. Catching that needs information from outside the band: a device’s history, its neighbours, or a supervised check.
Next
The local nominal values are a new signal in their own right. Joined with temperature, humidity and location they can show nominal drift over time and how neighbouring utilities compare. The thresholds come from U.S. standards, so the same pipeline should carry to other grids by swapping in their limits.
Client names, identifiers and raw data are covered by NDA. The cover is drawn from synthetic signals.
问题所在
每一个电能质量问题,比如电压是不是太高、太低、有没有漂移,都要相对于电路的额定电压(nominal voltage)来判断,也就是电路设计时的运行电压。智能电表(AMI)并不报告这个值。它们报告的是每 1 到 60 分钟一次的读数,按相、按变压器分别记录。
常见的变通办法是取每个信号的平均值,再把它对齐到标准电压表里最接近的值:120、208、240、277、480。这样做的前提是平均值有意义,但对于间隔几分钟的电表数据,平均值往往没有意义。IEEE 1159 定义的有效值(RMS)和平均值,是基于波形级分辨率的采样,而不是间隔几分钟的读数;而且真实的电表数据里有缺失、掉线和尖峰。一个接近 30,000 V 的读数,就能把一个月的平均值拉偏很多。
施耐德电气(Schneider Electric)提出的问题是:能不能只靠电表数据找出额定电压,而不用事先告诉它应该是哪个标准值?
不是查表
这个方法从不查标准电压表。它借用标准里的规则,比如健康的电压最多可以偏离多远、怎样才算不平衡,但不借用标准里的数值。每个电压档的额定电压都由它自己的读数估算出来,得到的是站点实际运行的值:478.4 V,而不是 480。
工作原理
先看信号是否稳定。 每个信号都会得到一个稳定的运行水平:对它的均值做 1,000 次重抽样的自助法(bootstrap),取结果的中位数,这个值几乎不受噪声和异常值的影响。只有在每一个七天窗口里,至少 95% 的读数都落在该水平的 ±5% 以内,信号才算稳定,这正是 IEEE 1159 认为额定值附近应有的波动范围。在 2,313 个信号的样本中,第 95 百分位的偏差为 4.4%,在限值以内。对于稳定的信号,剔除少数异常值,并用稳定水平填补短暂的缺失。不合格的信号则完全不做估算。
设备级筛查。 每台电表监测一台变压器,所以它的各相必须彼此一致。按 ANSI C84.1 的用电电压范围,大约是额定值的 −10% 到 +5%,因此任何一个电压档的最大值与最小值之比都不能超过 1.05 / 0.90 = 1.1667。同一台设备的各相如果超出这个比值,就属于电压档不一致。各相不平衡度超过 5% 的,会被标记为不平衡:ANSI 的现场调查显示,正常系统的不平衡度低于 3%,而这里 800 多台正常运行的设备,峰值为 4.1%。线电压和相电压的读数分开处理,因为在同一台设备上,它们总是落在不同的电压档。
按配置划分电压档。 电表按测量对象分组,L–L 和 L–N 信号分开聚类,因为它们的容差范围会重叠:240 V 的 L–L 档范围是 216–252 V,277 V 的 L–N 档是 249–291 V。信号按同样的 1.1667 规则归入某个档,每个形成的档都会再用这个规则检查一次;不合格的档会送去复核,而不是直接采信。每家企业都单独处理,因为同样的电表配置,在不同站点的表现也不一样。
每个档一个值。 每个通过验证的电压档,其额定电压是对档内所有读数做自助法得到的估计值。
结果
我们在来自 192 家美国企业的 151,033 个信号上做了评估,对照的是领域专家人工标注的额定值。因为这些标签是人定的,所以只把它们当作参照基准,而不是绝对正确的答案(ground truth)。
- 18,243 个信号被送去人工复核,而不是靠猜。 其中 16,170 个没通过稳定性检查,有些一个月里只有不到 50 个读数,而平均值法把其中约 18% 判成了大约 0 V。另外 2,073 个没通过电压档一致性或不平衡检查,平均值法给其中一半以上分配了错误的额定值,有一次甚至把同一台设备的三相分到了不同的标准电压上。
- 在通过筛查的 132,790 个信号上,一致率为 99.995%,平均值法为 99.868%。在干净的数据上差距很小,价值也不在这里:平均值法没有办法说我不知道,而这个方法可以。
- 它报告的是本地的运行值,比如某个时间段内的 478.44 V 或 472.95 V,而不是一个固定的参考值,这才是下游的漂移分析和电能质量分析真正需要的。
- 处理一个月的数据时,它每秒能处理 4 到 8 个信号。这比直接取平均要慢,所以它是为事后处理设计的,而不是实时监测。
它会在哪里出错
群体性的异常能骗过它。如果一台故障设备的所有相一起出错,这一组内部就是一致的,能通过筛查,并自成一个电压档。有一家企业就出现了一个 153.5 V 的档,跟任何标准电压都对不上。要发现这种情况,需要电压档以外的信息:设备的历史记录、周边的设备,或者有监督的检查。
下一步
本地额定值本身就是一种新的信号。结合温度、湿度和位置,它们可以显示额定值随时间的漂移,以及相邻电力公司之间的差异。这些阈值来自美国标准,所以只要换成其他电网的限值,同样的流程应该也能用在其他电网上。
客户名称、标识信息和原始数据受保密协议(NDA)保护。封面图由合成信号绘制。