2026 · Research研究 · DeepSense × Agrivanna · Under NDA保密协议
Self-Referenced NDVI Baselines for Grazing Decisions以每块地自身的 NDVI 历史为基准,辅助放牧决策
Nominated for the Mitacs Innovation Award. Two questions decide a rotation: is there still grass where the herd is standing, and which paddock does it move to next. Training a forage model normally needs ground-truth biomass — the one thing the industry cannot collect at scale — so this method needs none. Every 10 m square is judged against its own NDVI history instead of against a model fitted on someone else's field.获得 Mitacs 创新奖提名。轮牧要回答两个问题:牛群所在的地方还有没有草,下一步该转到哪块草场。训练牧草模型通常需要地面实测的生物量,而这正是这个行业没法大规模采集的东西,所以这个方法完全不需要它。每一块 10 米见方的地,都只和它自己过去的 NDVI 记录比较,而不是套用一个在别人草场上训练出来的模型。
- Nominated for获得提名
- Mitacs Innovation AwardMitacs 创新奖
- Of the accuracy gain came from fixing the data, not the model准确率的提升来自修正数据,而不是改进模型
- 96%96%
- Offline tests in the delivered package交付软件包中的离线测试
- 522522
The question
A rancher rotating cattle between paddocks asks the same two questions every week. Is there still grass where the herd is standing — and if not, which paddock does it go to next. Both are answered today by getting on a quad bike and looking.
Sentinel-2 photographs every 10 m square of every paddock every few days, for free, and has done since 2017. Agrivanna, through the DeepSense industry programme, asked whether NDVI from that free record is enough to answer both — with no ground sensors, no field visits and no paid imagery.
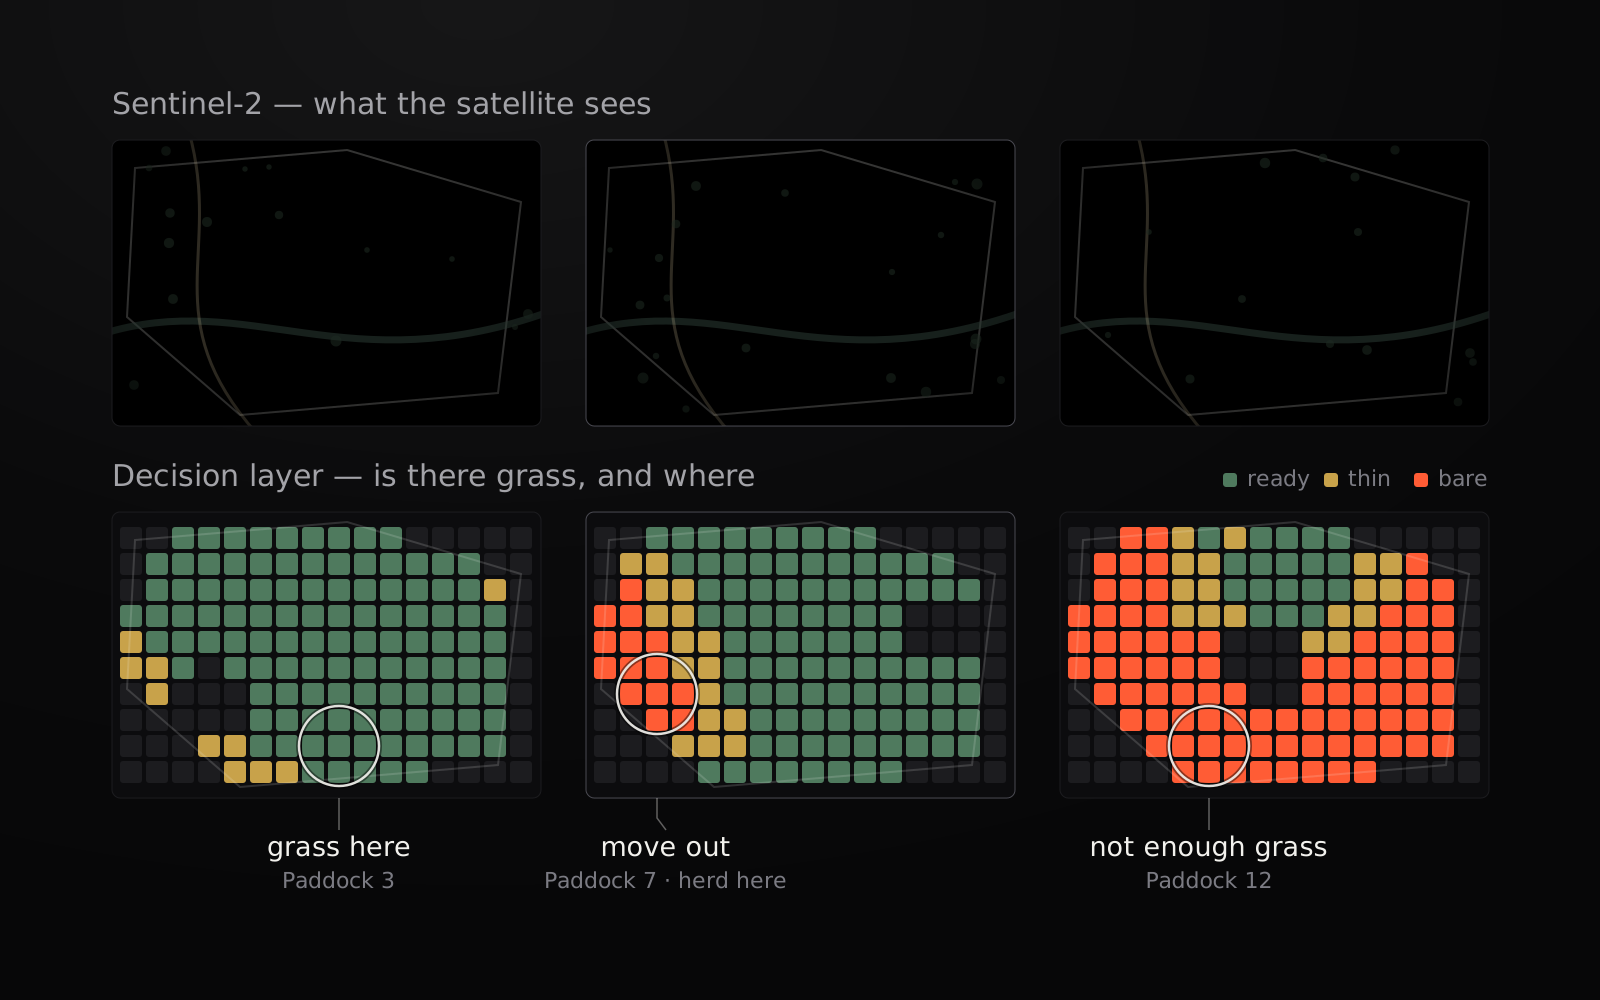
The cover is the answer in miniature: three paddocks on one morning, the satellite view above and the per-pixel verdict below. One says move out, one says not there, one says the grass is here.
The research path
This was not one model. It was a sequence of questions, and most of the useful findings were things that turned out not to work.
1. Leaf area from a single image
I started from the public GROUNDED EO database, which pairs field-measured leaf area index with Sentinel-2 passes, filtered to grassland, shrub and pasture (1,577 samples across 26 sites). XGBoost, an MLP and a CNN were compared under one protocol — every sample from a site held out together, so the score reflects ground the model has never seen.
- Moisture indices, not greenness, carried the signal: MSI and NDMI accounted for about 60% of feature importance, NDVI for 11%.
- Log-transforming the target was the single largest gain; raw leaf area is heavily skewed towards zero.
- Spatial context was worthless. A plain CNN, a point-wise 1×1 network and a small ResNet tied on held-out sites (MAE 0.143 / 0.139 / 0.141), so the CNN was dropped in favour of the tabular models (site-held-out MAE ≈ 0.10).
- Sentinel-1 radar did not separate leaf area, and weather was explanatory but not predictive — its correlation collapsed once the spectral indices were controlled for.
2. Biomass, and the labels nobody has
Leaf area is only a proxy, so the next step was biomass itself, using public clip-harvest records (NEON, and a long-running Colorado rangeland dataset). Within a site the models work — R² 0.72 on unseen years. Across sites they do not: pooled over the Northern Plains, R² fell to 0.06. NDVI alone carries roughly a sixth of the attainable signal; the raw bands carry far more.
That result changed the plan, and it is worth being blunt about why, because it is the wall this whole industry runs into. Training a forage model requires ground-truth biomass, and ground-truth biomass means someone cutting, drying and weighing a quadrat by hand. It is slow, destructive and expensive, so the public record is thin and clustered in a handful of research sites — and, as the numbers above show, a model fitted on those sites does not transfer to a farm that has none. No commercial rollout can wait on collecting clip-harvest data farm by farm, which is why forage products keep stalling at the pilot.
So the work moved to a quantity that needs no labels at all: each pixel’s own greenness history. A pixel becomes its own control, and the question changes from how many kilograms are standing here — unanswerable without a ground crew — to is this square worse than it has been at this point in every previous year, which the free archive answers on its own. That is what makes the method deployable on a farm with zero ground measurements.
3. Filling the gaps between clear days
Clouds remove most satellite passes, so the practical problem became estimating NDVI on the days nothing was seen. Eight designs were tested — clustering farms into cohorts, nearest-neighbour retrieval with soil and phenology signatures, seasonal decomposition, a global GRU. All seven alternatives lost to a plain XGBoost on the full pool.
Then the important finding: the acquisition script had been requesting only three or four months of imagery per year. Rebuilding the record densely took the error from 0.083 to 0.037 NDVI, and a like-for-like comparison showed 96% of that gain came from the record and 4% from the model.
Two of my own results did not survive review. An LSTM accuracy figure came from a fit I could not reproduce, so it was withdrawn and the package makes no LSTM claim. A phenology-embedding result looked strong at one site and failed to replicate at three others; the claims built on it were retracted.
What shipped
agrivanna-forage takes a farm boundary file and returns one of three answers
per paddock per day: move, stay, or field check. That answers the
first question. Run across every paddock on the farm, the same answer orders
them, and that is the second: the ground still reading stay is where the herd
can go.
The rule behind it is one idea repeated per pixel: judge every 10 m square only against its own past at the same time of year — never against its neighbour or a regional average. A hilltop that is always thin is not penalised for being thin; a lush corner having one of its worst Julys on record is flagged even though it still looks green. An absolute floor, taken from each pixel’s own dormant-season readings, catches ground that has been poor every year. When there is not enough evidence, the system says so and asks for a field check rather than guessing.
It ships as an installable package with a CLI and Python API, 522 offline tests, a provenance record behind every published number, and standalone scripts that regenerate each headline figure. The work was nominated for the Mitacs Innovation Award.
What it does and does not do
Evaluated on two working ranches — one used for calibration, one validated independently by the partner’s team — the gap-filling model beat carry-the-last-value-forward by 6–9%, on every random seed. A model has to be fitted per farm; a single shared model lost to doing nothing at all on the second ranch. Two to three years of a farm’s own free imagery is enough to onboard it.
The gains are real and small, and the binding limit is elsewhere. The colour rule misses more than half of genuinely depleted pixels, because the boundary between its warning bands is narrower than the best achievable model error. Recalibrating the model does not fix that — it was measured. Fixing it means changing the rule.
Nothing here has yet been validated against measured biomass, sward height or a rancher’s actual decision to move. It is decision support: water, fences, access and herd demand are not visible from orbit.
Farm names, locations and the underlying client data are protected under NDA.
What I would do differently
Audit the data acquisition before the first model. Months went into architectures that could not have mattered while the record was a third of what it should have been. And define the decision rule — and its error budget — before optimising the model feeding it: the model turned out not to be the weakest link.
要回答的问题
在几块草场之间轮流放牧的牧场主,每周都要问同样的两个问题:牛群所在的地方还有没有草?如果没有,下一步该转到哪块草场?如今这两个问题都靠骑上四轮摩托车,亲自去现场看。
Sentinel-2 卫星每隔几天就会免费拍下每块草场上每一个 10 米见方的格子,从 2017 年起一直如此。Agrivanna 通过 DeepSense 的产业合作项目提出了一个问题:只靠这份免费记录里的 NDVI,能不能回答这两个问题?不装地面传感器,不去实地考察,也不买付费影像。
封面图就是答案的缩影:同一天早上的三块草场,上面是卫星图像,下面是逐个像素的判断结果。一块说该转场了,一块说别去那里,一块说草就在这儿。
研究过程
这不是一个模型,而是一连串的问题,而且大多数有用的发现,都是后来证明行不通的东西。
1. 从单张影像估算叶面积
我从公开的 GROUNDED EO 数据库入手。它把实地测量的叶面积指数(LAI)和 Sentinel-2 的过境影像配对,我从中筛选出草地、灌木和牧场的数据(26 个站点,共 1,577 个样本)。XGBoost、MLP 和 CNN 在同一套规则下比较:同一个站点的所有样本一起留出作为测试,所以得分反映的是模型在从未见过的土地上的表现。
- 真正有用的是水分指数,而不是绿度:MSI 和 NDMI 占了大约 60% 的特征重要性,NDVI 只占 11%。
- 对目标值取对数是单项最大的提升,因为原始的叶面积数据严重偏向零。
- 空间上下文毫无用处。 普通 CNN、逐点的 1×1 网络和一个小型 ResNet 在留出的站点上成绩不相上下(MAE 分别为 0.143 / 0.139 / 0.141),所以放弃了 CNN,改用表格模型(按站点留出的 MAE ≈ 0.10)。
- Sentinel-1 雷达无法区分叶面积。天气能解释现象,却不能用来预测:一旦控制了光谱指数,它的相关性就消失了。
2. 生物量,以及谁都没有的标签
叶面积只是一个间接指标,所以下一步是直接估算生物量,用的是公开的刈割称重记录(NEON,以及科罗拉多州一个长期的草原数据集)。在同一个站点内,模型是有效的:在没见过的年份上 R² 为 0.72。跨站点就不行了:把北部大平原的数据合在一起,R² 降到了 0.06。单靠 NDVI 大约只能拿到可获得信号的六分之一,原始波段包含的信息要多得多。
这个结果改变了计划。原因值得直说,因为这正是整个行业都会撞上的墙。训练牧草模型需要地面实测的生物量,而地面实测生物量意味着要有人亲手把一块样方里的草割下来、烘干、称重。 这样做又慢、又有破坏性、又贵,所以公开的记录很少,而且集中在少数几个研究站点。正如上面的数字所示,在这些站点上训练出的模型,换到一个没有任何实测数据的农场就不管用了。任何商业推广都不可能等着一个农场一个农场地去采集刈割数据,这也是牧草产品总是停在试点阶段的原因。
于是工作转向了一个完全不需要标签的量:每个像素自己的绿度历史。每个像素都成了自己的对照组,问题也从这里长着多少公斤草(没有地面人员就无法回答),变成了这块地是不是比往年同一时间都差,而这个问题只靠免费的影像档案就能回答。正因如此,这个方法可以用在一个没有任何地面测量数据的农场上。
3. 填补晴天之间的空白
云层会挡住大部分卫星过境,所以实际的问题变成了:在什么都没拍到的日子里,怎么估算 NDVI。我测试了八种设计:把农场聚类分组、结合土壤和物候特征的最近邻检索、季节分解,以及一个全局 GRU。其余七种方案全都输给了在全部数据上训练的普通 XGBoost。
接着是关键的发现:数据获取脚本每年只请求了三四个月的影像。把记录重新密集地建好之后,误差从 0.083 降到了 0.037 NDVI。同等条件下的比较显示,这项提升有 96% 来自数据记录,只有 4% 来自模型。
我自己有两个结果没能通过复核。一个 LSTM 的准确率数字来自一次我无法复现的拟合,所以撤回了,交付的软件包里没有任何关于 LSTM 的结论。一个物候嵌入的结果在一个站点上看起来很好,但在另外三个站点上没能复现,基于它得出的结论也都撤回了。
交付了什么
agrivanna-forage 读入一个农场边界文件,每天为每块草场给出三种答案之一:转场(move)、留下(stay) 或 实地查看(field check)。这回答了第一个问题。把它用在农场的每一块草场上,同样的答案就能给草场排出先后,这就回答了第二个问题:仍然显示 留下 的地方,就是牛群可以去的地方。
背后的规则是一个想法,在每个像素上重复使用:每一个 10 米见方的格子,只和它自己往年同一时期的情况比较,从不和旁边的地或地区平均值比较。一个一直很贫瘠的山顶,不会因为贫瘠而被扣分;一个茂盛的角落,如果正经历有记录以来最差的几个七月之一,即使看上去还是绿的,也会被标记出来。另外还有一条绝对下限,取自每个像素自己在休眠季的读数,用来发现那些年年都很差的地。证据不够时,系统会如实说明,并要求实地查看,而不是去猜。
它以可安装的软件包形式交付,带有命令行工具(CLI)和 Python API、522 个离线测试,每个公布的数字背后都有来源记录,还有能重新生成每个主要数据的独立脚本。这项工作获得了 Mitacs 创新奖(Mitacs Innovation Award)提名。
它能做什么,不能做什么
我们在两个实际运营的牧场上做了评估:一个用来校准,另一个由合作方团队独立验证。补全模型比“沿用上一次的值”好 6–9%,而且每个随机种子下都是如此。模型需要针对每个农场单独拟合;一个所有农场共用的模型,在第二个牧场上还不如什么都不做。一个农场只要有两到三年自己的免费影像,就足以接入。
这些提升是真实的,但幅度不大,真正的限制在别处。颜色规则漏掉了一半以上真正退化的像素,因为它各个预警档之间的界限,比模型能达到的最小误差还要窄。重新校准模型解决不了这个问题,这一点已经实测过。要解决它,就得改规则。
这里的一切都还没有和实测的生物量、草层高度或牧场主实际的转场决定做过对照验证。它是一个决策辅助工具:水源、围栏、通行条件和牛群的需求,都没法从太空中看到。
农场名称、位置和底层的客户数据均受保密协议(NDA)保护。
如果重来,我会怎么做
在训练第一个模型之前,先检查数据是怎么获取的。数据记录只有应有规模的三分之一时,我花了好几个月研究各种模型架构,而那些在当时根本不可能起作用。还有,在优化为决策规则提供输入的模型之前,先定好决策规则和它的误差预算:结果证明,模型并不是最薄弱的环节。