2026 · Data Science数据科学
Severe Accident Prediction — How Far Weather and Road Data Can Go严重事故预测:天气和道路数据能走多远
Can a model tell from the conditions at the scene whether a road accident will be severe? On 189,205 US accidents, weather carried almost no signal, the type of road carried some, and the best logistic regression reached a ROC-AUC of 0.65. The strongest-looking predictor of all turned out to be the agency that reported the crash, so it had to be left out.模型能否仅凭事故现场的条件,判断一起交通事故会不会很严重?在 189,205 起美国交通事故上,天气几乎没有提供任何信号,道路类型提供了一些,最好的逻辑回归模型 ROC-AUC 达到 0.65。看起来最强的预测因素,结果竟是上报事故的机构,所以只能把它排除在外。
- Accidents after cleaning清洗后的事故数
- 189,205189,205
- Best ROC-AUC最佳 ROC-AUC
- 0.650.65
- Severe accidents the best model catches最佳模型识别出的严重事故比例
- 72%72%
The question
The US Accidents dataset (Moosavi et al., 2019) covers 7.7 million accidents in 49 states from 2016 to 2023, each with the weather at the time and flags for nearby road features such as traffic signals, crossings and junctions. I worked with a random sample and asked a simple question. Given the conditions at the scene, can a model tell whether an accident will be severe?
The original severity runs from 1 to 4. Levels 1 and 2 behaved almost identically on every feature, and so did 3 and 4, so I collapsed them into severe and not severe. About 19% of accidents are severe, which means a model that always says “not severe” is already 81% accurate. Accuracy is the wrong yardstick here, so every model is judged on recall for the severe class and on ROC-AUC.
Cleaning by how each sensor fails
One global outlier rule would have damaged some columns and missed problems in others, so each feature got its own treatment. Visibility sensors cap at 10 miles, so higher readings are errors. Temperatures outside −40 to 130 °F and pressures outside 25 to 32 inHg mean the whole reading is broken, so those rows were dropped. Humidity was clipped to 0 to 100%. Wind chill was 26% missing and mostly repeats temperature, so it was removed. Missing precipitation most likely means no rain was reported, so it became zero with a flag recording that it was missing.
A predictor I had to leave out
The column that separated severe accidents best wasn’t about the road at all. It was the agency that reported the crash. One source labels 8% of its accidents severe, another 34%.
问题
US Accidents 数据集(Moosavi 等人,2019)收录了 2016 年到 2023 年间 49 个州的 770 万起交通事故,每一起都记录了当时的天气,并标注了附近是否有交通信号灯、人行横道、路口等道路设施。我取了一个随机样本,提出一个简单的问题:根据事故现场的条件,模型能否判断一起事故会不会很严重?
原始的严重程度分为 1 到 4 级。1 级和 2 级在每个特征上的表现几乎一样,3 级和 4 级也是如此,所以我把它们合并成“严重”和“不严重”两类。大约 19% 的事故属于严重事故,也就是说,一个永远回答“不严重”的模型,准确率就已经有 81%。在这里,准确率不是合适的衡量标准,所以每个模型都用严重类别的召回率和 ROC-AUC 来评估。
按每种传感器的出错方式来清洗数据
如果用一条统一的异常值规则,会损坏一些列,又会漏掉另一些列里的问题,所以每个特征都单独处理。能见度传感器的上限是 10 英里,所以更高的读数都是错误。温度超出 −40 到 130 °F、气压超出 25 到 32 inHg,说明整条读数都坏了,这些行被删掉。湿度被截断在 0 到 100% 之间。风寒指数有 26% 缺失,而且大部分只是重复温度,所以被移除。降水量缺失,很可能意味着当时没有报告下雨,所以记为零,同时加一个标记,记录它原本是缺失的。
一个不得不排除的预测因素
最能区分严重事故的一列,根本和道路无关,而是上报事故的机构。有一个来源把 8% 的事故标为严重,另一个则是 34%。
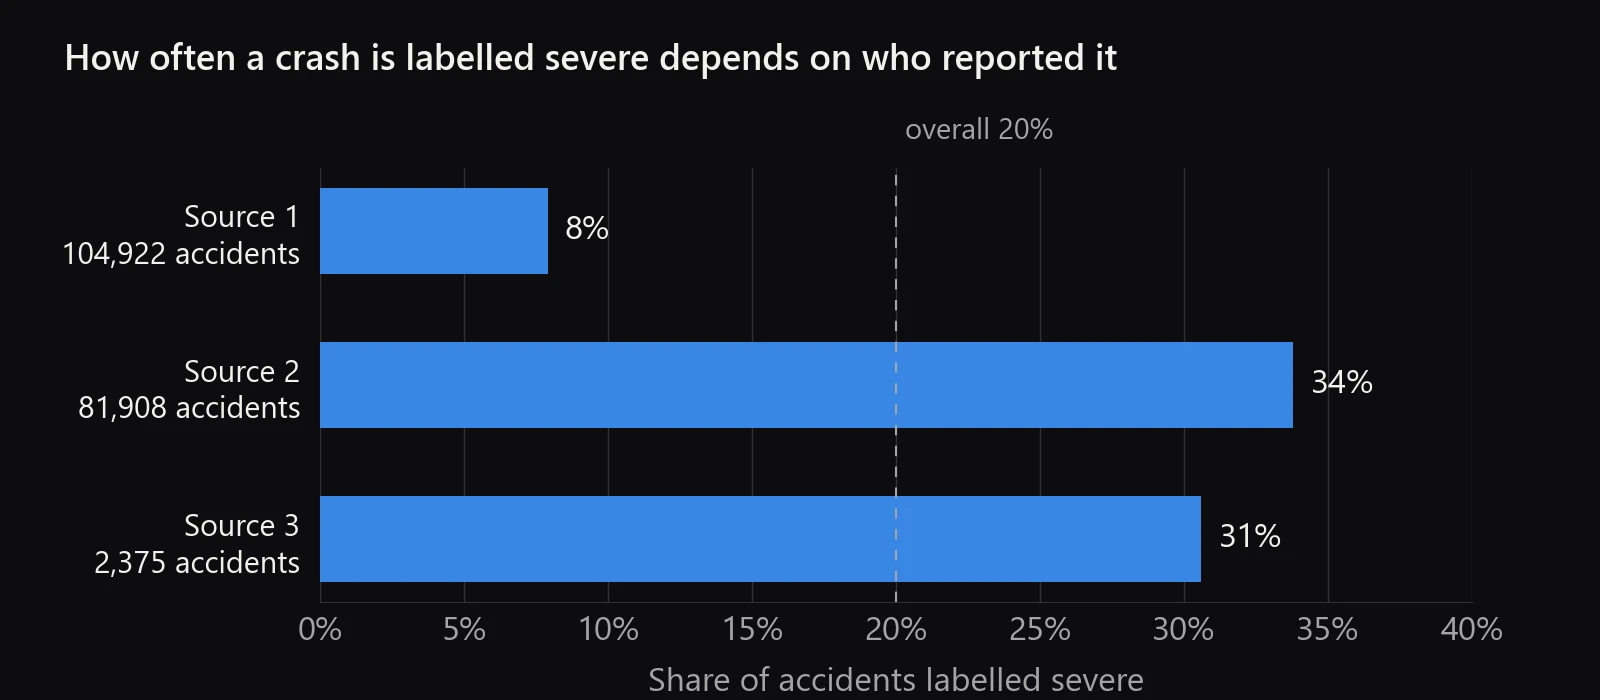
A model that uses the source learns who wrote the label, not how dangerous the crash was, and it would fall apart the moment a new agency joined. I left it out, along with the missing-precipitation flag, which turned out to be a stand-in for the source because each agency records missing weather differently.
What actually predicts severity
Weather barely does. Visibility and precipitation on their own score an AUC of 0.51, a coin flip. Road features do better. Near a traffic signal, 9% of accidents are severe, against 21% elsewhere. That isn’t because signals make crashes safer. Signals, crossings and stop signs mark slower urban roads, where severe crashes are rarer, and the model is really reading the type of road.
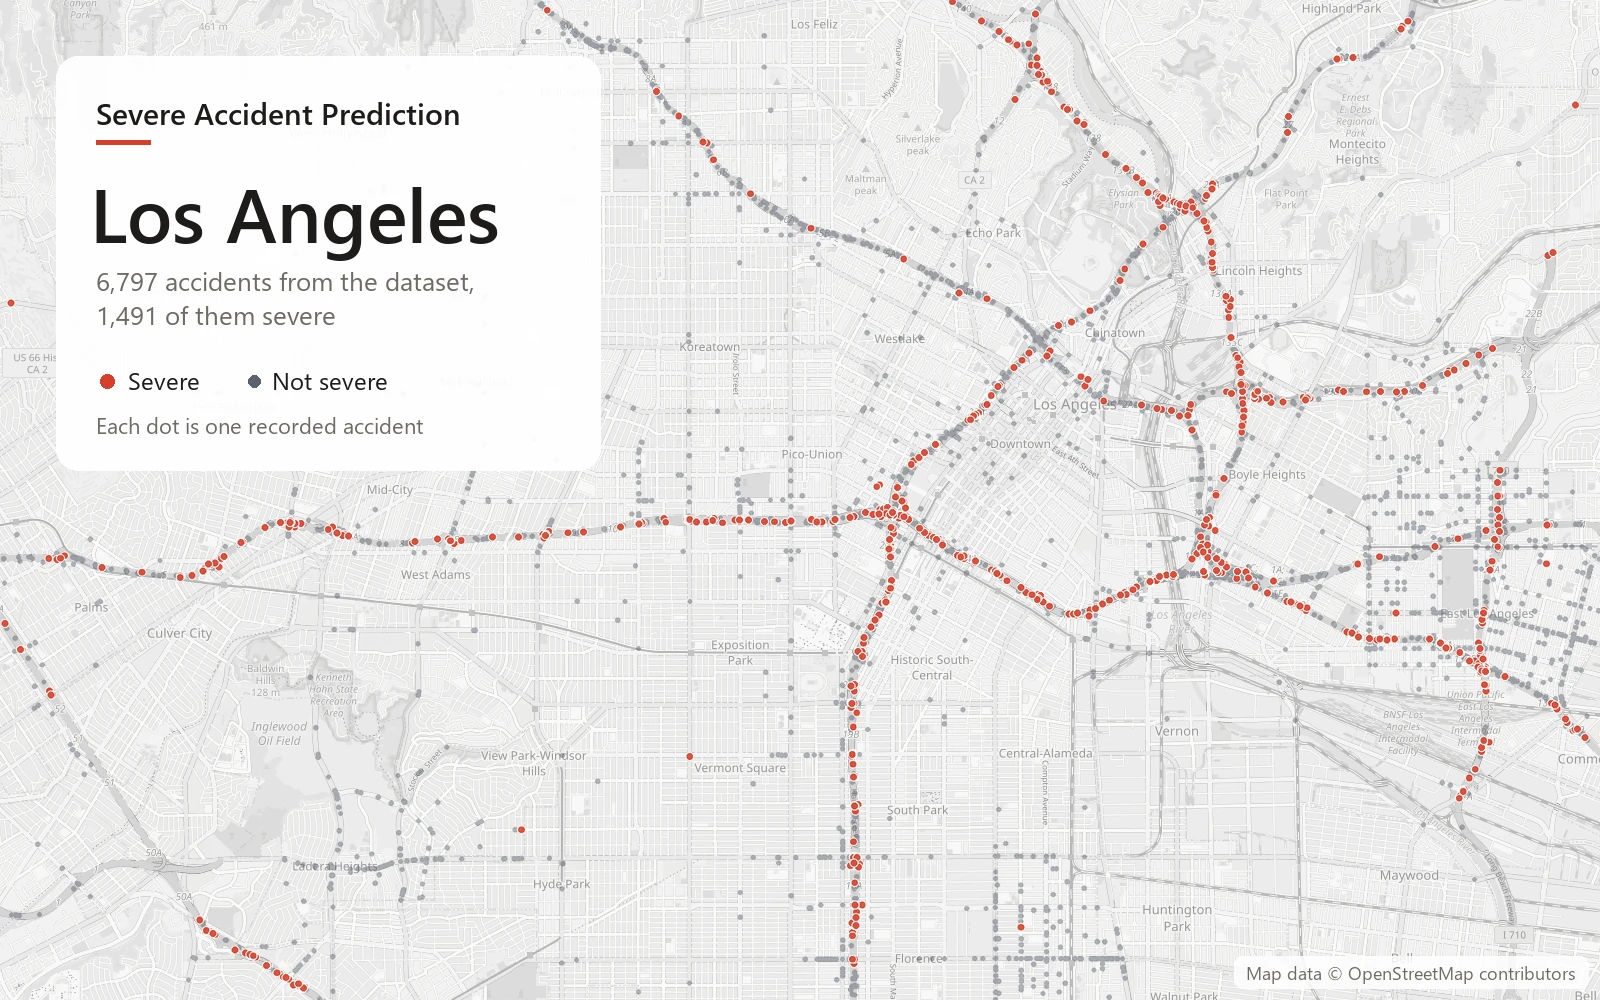
The cover shows it on a real map. It plots every Los Angeles accident in the sample, and the severe ones trace the freeways almost exactly, while the surface streets are mostly grey.
使用来源这一列的模型,学到的是谁写下了这个标签,而不是事故有多危险。一旦有新的机构加入,它就会失效。所以我把它排除了,同时也排除了降水缺失标记,因为后来发现它其实是来源的替身:每个机构记录缺失天气的方式都不一样。
真正能预测严重程度的是什么
天气几乎预测不了。单靠能见度或单靠降水,AUC 都只有 0.51,和抛硬币差不多。道路设施的表现好一些。在交通信号灯附近,9% 的事故是严重事故,而其他地方是 21%。这并不是因为信号灯让事故变得更安全。信号灯、人行横道和停车标志通常出现在车速较慢的城市道路,那里严重事故本来就少,模型真正读到的其实是道路类型。
封面图在一张真实的地图上展示了这一点。它画出了样本中洛杉矶的每一起事故,严重事故几乎完全沿着高速公路分布,而普通街道上大多是灰色的。
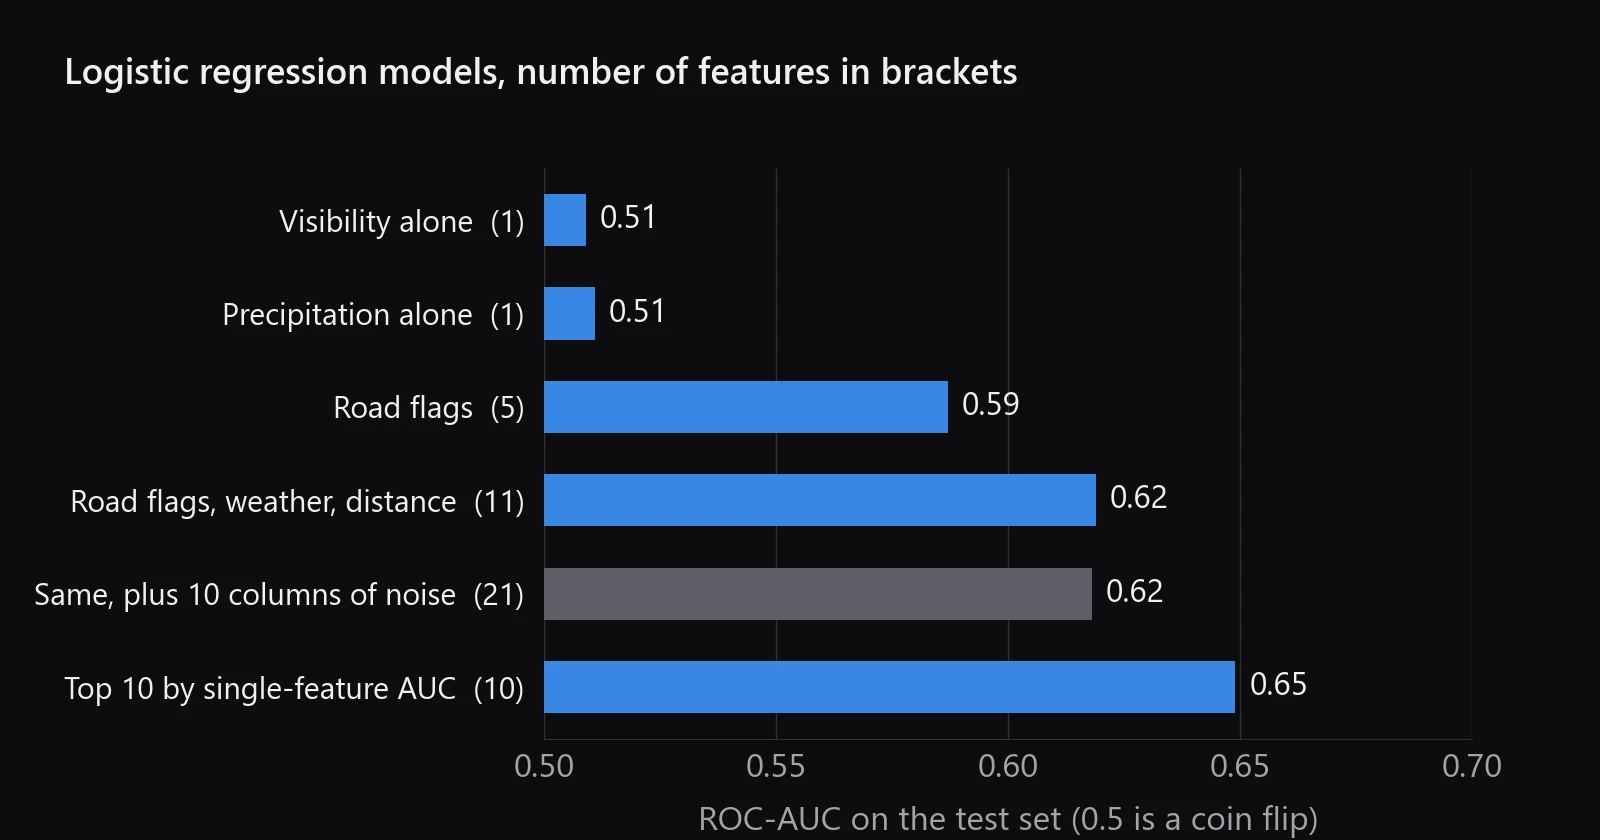
Adding weather and distance to the road flags lifted the AUC from 0.59 to 0.62. Adding ten columns of random noise on top changed nothing, a simple check that more features only help when they carry information. The best model picked its ten features by how well each ranked severity alone, which brought in location and state, and it reached 0.65. With class weights balanced, it catches 72% of severe accidents, but only about a quarter of its alarms are right.
What it means
With the conditions at the scene alone, a model can rank accidents a little better than chance and no more. That is enough to help prioritise a review, and not enough to trust as an automatic warning. The signals that would help most, like speed limits, traffic volume and how the crash happened, aren’t in this data.
在道路设施标记的基础上加入天气和距离,AUC 从 0.59 提高到 0.62。再额外加上十列随机噪声,结果没有任何变化,这是一个简单的检验:只有带信息的特征才有用,特征多了不一定好。最好的模型按每个特征单独对严重程度的排序能力挑出了十个特征,其中包括位置和州,AUC 达到 0.65。在类别权重平衡的情况下,它能识别出 72% 的严重事故,但它发出的警报只有大约四分之一是对的。
这意味着什么
只凭事故现场的条件,模型对事故的排序只能比随机猜测好一点,仅此而已。这足以帮助确定审查的先后顺序,但还不足以作为自动预警来信赖。最有帮助的信号,比如限速、车流量和事故是怎么发生的,都不在这份数据里。