2026 · Data Science数据科学
NBA Performance Analysis — Four Questions About Half a SeasonNBA 表现分析:关于半个赛季的四个问题
Four small machine-learning studies on 16,512 player-games from the 2024-25 NBA season, up to early February. Who scores more than their shots should give them, whether tonight's shooting can be predicted, what types of player the data finds on its own, and which games were the strangest. Each answer is checked against what basketball fans already know.基于 2024-25 NBA 赛季(截至 2 月初)16,512 条球员单场记录的四个小型机器学习研究:谁的得分超出了他的出手应有的水平,今晚的投篮表现能不能预测,数据自己能找出哪些类型的球员,以及哪些比赛最反常。每个答案都会和球迷已经知道的情况对照检验。
- Player-games, Oct 2024 to Feb 2025球员单场记录,2024 年 10 月至 2025 年 2 月
- 16,51216,512
- Error of the expected-points model预期得分模型的误差
- 2.6 pts2.6 分
- Share of next-game shooting a model can explain模型能解释的下一场投篮表现占比
- 6%6%
The data
One row per player per game, with the full box score, from opening night on
October 22, 2024 to early February 2025. That is 562 players across all 30 teams,
about 51 games each. Before any model, the first notebook checks that the data
looks like the real league. The scoring leaders are Shai Gilgeous-Alexander,
Giannis Antetokounmpo and Nikola Jokić, and Cleveland and Oklahoma City lead the
standings, so the data holds up. It also flags the traps, such as FG predicting
PTS almost perfectly simply because points are made of field goals.
The project is four notebooks on that one dataset, each written to be followed by someone new to machine learning.
Who scores more than expected
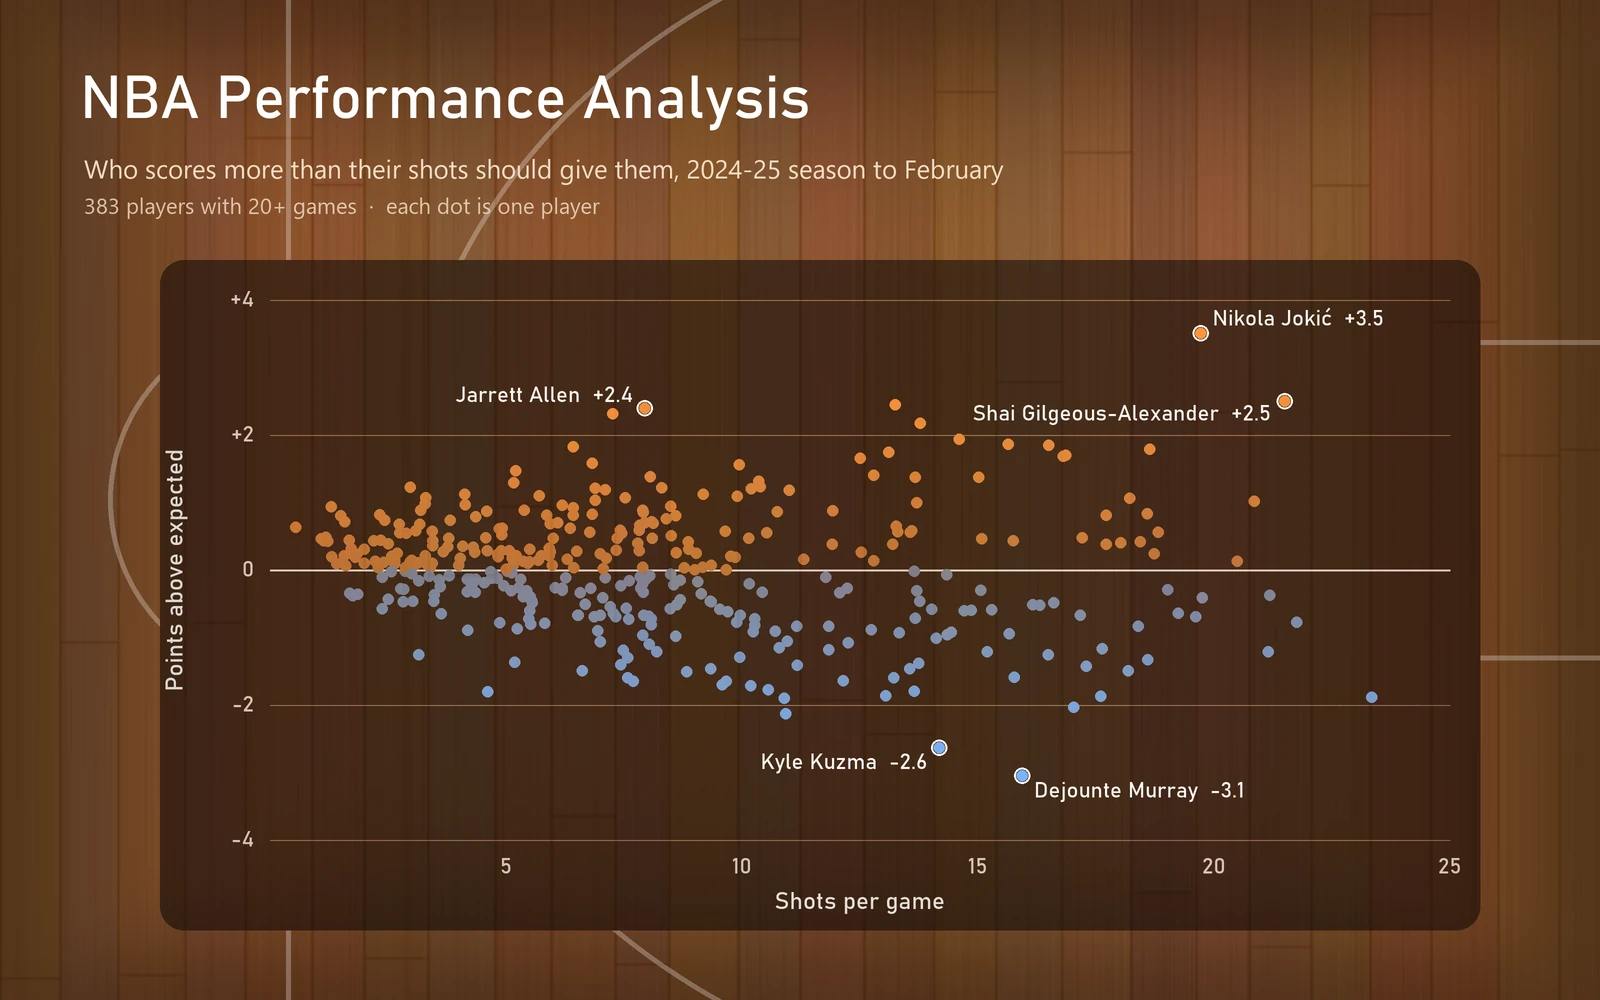
A linear regression predicts how many points an average shooter would score from a player’s minutes, shots, threes and free throws. It is accurate to about 2.6 points a game (R² 0.85), and its weights rediscover the rules of the game. Each shot is worth about one point and each free throw about 0.8, matching league shooting averages.
Whatever a player scores beyond that is their edge. Averaged over at least 20 games, Jokić leads the league at 3.5 points a game above expected, which is what the cover shows. Jarrett Allen and Daniel Gafford beat it on few shots, close to the rim. Dejounte Murray and Kyle Kuzma take plenty of shots and fall 2 to 3 points short. A random forest ranked players almost exactly the same way, with a correlation of 0.98, so the ranking isn’t an artefact of one model.
Can tonight’s shooting be predicted
Mostly not. True shooting percentage swings so much from game to game that a player’s own season average barely beats guessing the league mean. With a split by date, so the model never trains on the future, the best of three models explained about 6% of the variation. That is a real answer too. Hot and cold nights are mostly noise.
What types of player exist
Averaging each player’s style stats and clustering them with k-means found five groups that match how the game is described, without being told any positions.
| Group | Players | Examples |
|---|---|---|
| Interior bigs | 42 | Ivica Zubac, Jarrett Allen, Daniel Gafford |
| Wings and shooters | 175 | Mikal Bridges, Klay Thompson, Payton Pritchard |
| Low-usage bench | 103 | Seth Curry, Kevin Love |
| Primary creators | 65 | Gilgeous-Alexander, Jokić, Luka Dončić |
| Two-way scoring bigs | 54 | Giannis, Victor Wembanyama, Anthony Davis |
The strangest games
An isolation forest scored all 12,151 games of at least 15 minutes by how unusual the whole stat line was. Its top games are the ones fans remember. Giannis scored 59 against Detroit with 16 free throws, Anthony Edwards hit 10 threes for 53, and Paolo Banchero went to the line 22 times for 50. For each one, the notebook shows which stats made it unusual. A second method, local outlier factor, looks for odd combinations instead of extremes and found different games, such as a 21-assist, 14-point night. The two lists share 11 of their top 50, because “unusual” can mean more than one thing.
数据
每名球员每场比赛一行,包含完整的技术统计,时间从 2024 年 10 月 22 日的揭幕之夜到 2025 年 2 月初。共有来自全部 30 支球队的 562 名球员,平均每人约 51 场。在建任何模型之前,第一个 notebook 先检查数据和真实的联盟是否对得上。得分榜前列是谢伊·吉尔杰斯-亚历山大(Shai Gilgeous-Alexander)、字母哥(Giannis Antetokounmpo)和约基奇(Nikola Jokić),骑士和雷霆领跑联盟排名,所以数据是可靠的。它还标出了一些陷阱,比如 FG 几乎能完美预测 PTS,原因很简单:得分本来就是由投篮命中构成的。
这个项目是基于同一个数据集的四个 notebook,每一个都写得让机器学习新手也能跟得上。
谁的得分超出预期
一个线性回归根据球员的上场时间、出手、三分球和罚球,预测一名普通射手能得多少分。它的误差约为每场 2.6 分(R² 0.85),而且它的权重自己重新发现了比赛规则:每次出手大约值 1 分,每次罚球大约值 0.8 分,和联盟的平均命中率一致。
球员超出这个预测的得分,就是他的优势。在至少 20 场比赛中取平均,约基奇以每场高出预期 3.5 分领跑联盟,封面图展示的就是这一点。贾勒特·阿伦(Jarrett Allen)和丹尼尔·加福德(Daniel Gafford)出手不多,而且都在篮下附近,却能超出预期。德章泰·穆雷(Dejounte Murray)和凯尔·库兹马(Kyle Kuzma)出手很多,却比预期少 2 到 3 分。随机森林给出的球员排名几乎完全一样,相关系数为 0.98,所以这个排名并不是某一个模型造成的假象。
今晚的投篮能预测吗
基本不能。真实命中率在每场之间波动太大,用球员自己的赛季平均值去预测,也只比直接猜联盟平均值好一点点。按日期划分数据,让模型永远不会用未来的比赛来训练,三个模型中最好的一个也只解释了约 6% 的变化。这本身也是一个真实的答案:手热和手冷的夜晚,大多只是随机波动。
有哪些类型的球员
把每名球员的风格类数据取平均,再用 k-means 聚类,找到了五个组。没有告诉模型任何位置信息,这些组却和人们描述比赛的方式相吻合。
| 类型 | 球员数 | 例子 |
|---|---|---|
| 内线大个子 | 42 | Ivica Zubac, Jarrett Allen, Daniel Gafford |
| 锋线与射手 | 175 | Mikal Bridges, Klay Thompson, Payton Pritchard |
| 低使用率替补 | 103 | Seth Curry, Kevin Love |
| 主要进攻发起者 | 65 | Gilgeous-Alexander, Jokić, Luka Dončić |
| 攻守兼备的得分型大个子 | 54 | Giannis, Victor Wembanyama, Anthony Davis |
最反常的比赛
孤立森林(isolation forest)给所有上场至少 15 分钟的 12,151 场比赛打分,看整条数据线有多不寻常。排在最前面的,正是球迷记得的那些比赛:字母哥对活塞砍下 59 分,其中有 16 个罚球;安东尼·爱德华兹(Anthony Edwards)投进 10 个三分,拿下 53 分;保罗·班凯罗(Paolo Banchero)22 次站上罚球线,得到 50 分。对每一场比赛,notebook 都会展示是哪些数据让它显得反常。第二种方法是局部异常因子(local outlier factor),它找的是奇怪的组合,而不是极端值,找到的比赛也不一样,比如一场 21 次助攻、14 分的比赛。两份名单的前 50 名中有 11 场重合,因为“反常”可以有不止一种含义。