2025 · Studies学习笔记
Hypothesis Testing, One Question Worked Through假设检验:从头到尾解答一个问题
One question carried from start to finish. Are a university's graduates paid more than the $50,000 national average? The study builds the null distribution, the t statistic, the p-value and the critical value in turn, then the difference between one-tailed and two-tailed tests.把一个问题从头追到尾:某所大学毕业生的工资,是否高于 $50,000 的全国平均水平?研究依次构建原假设下的分布、t 统计量、p 值和临界值,最后讲清单尾检验和双尾检验的区别。
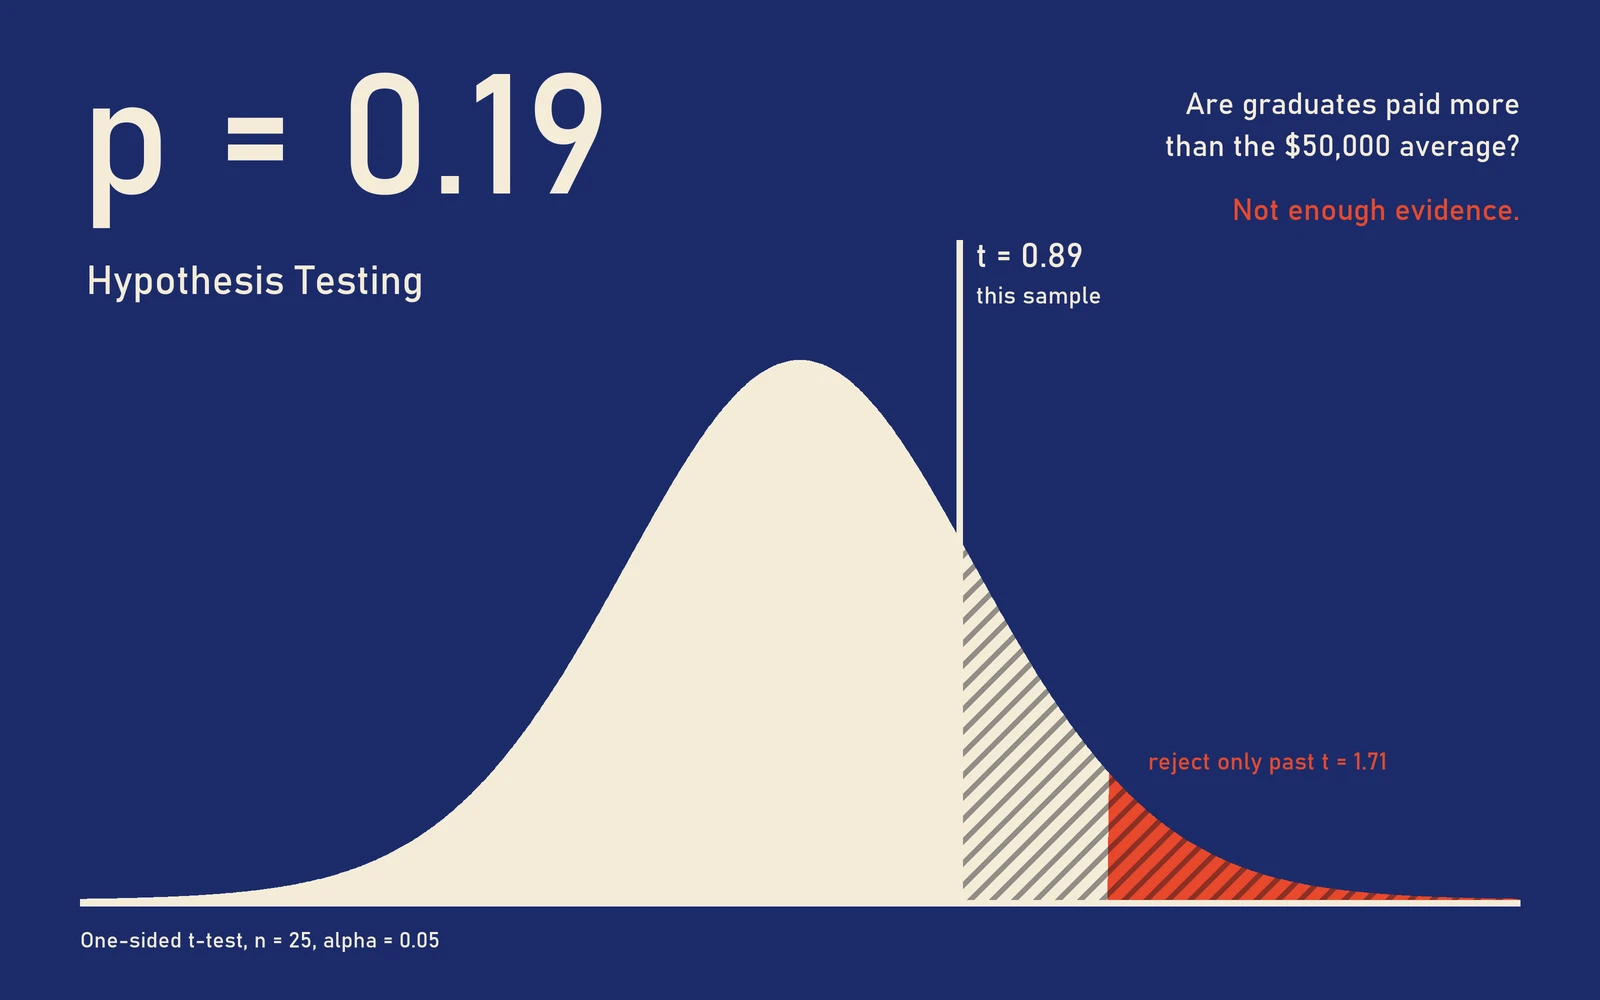
The study follows a single question the whole way through. A sample of 25 graduates earns $51,019 on average. Is that really more than the $50,000 national average, or could a sample like this turn up by chance?
Why the bell curve. If the true average were $50,000, the averages of repeated samples would form a bell shape around it, even when salaries themselves are skewed. The study shows this with a skewed population, drawing 30 values at a time, 500 times over, in ten separate runs. Every run comes out bell-shaped.
From the sample to a number. The t statistic measures how far the sample mean is from $50,000 in units of standard error, the spread you would expect from sample to sample, not the spread of individual salaries. Here t = 0.89. The p-value is the share of the t-distribution beyond that point, 0.19. A result like this would show up about one time in five even if graduates earned exactly the national average.
Making the call. With a 5% significance level and 24 degrees of freedom, the cutoff is t = 1.71. The sample doesn’t reach it, so the answer is that there isn’t enough evidence. That is not the same as showing there is no difference. The same $1,019 gap with the same spread would pass the test with about 100 graduates instead of 25.
One tail or two. Asking whether graduates earn more puts the whole 5% in one tail. Asking whether they earn differently, in either direction, splits it between both tails, which doubles the p-value to 0.38 and makes the test harder to pass.
这个研究自始至终围绕一个问题展开。抽取的 25 名毕业生平均收入为 $51,019。这真的高于 $50,000 的全国平均水平吗?还是说,这样的样本只是碰巧抽出来的?
为什么是钟形曲线。 如果真实平均值是 $50,000,那么反复抽样得到的平均数会围绕它形成一个钟形,即使工资本身的分布是偏态的。研究用一个偏态总体来演示:每次抽 30 个值,抽 500 次,分十轮独立进行。每一轮的结果都呈钟形。
从样本到一个数字。 t 统计量衡量的是样本均值离 $50,000 有多远,单位是标准误,也就是不同样本之间预期会有的波动,而不是单个人工资之间的差异。这里 t = 0.89。p 值是 t 分布中超过这个点的那部分所占的比例,为 0.19。也就是说,即使毕业生的收入恰好等于全国平均水平,大约每五次也会出现一次这样的结果。
做出判断。 取 5% 的显著性水平、24 个自由度,临界值是 t = 1.71。样本没有达到这个值,所以结论是证据不足。这和证明两者没有差别并不是一回事。同样 $1,019 的差距、同样的离散程度,如果样本是大约 100 名毕业生而不是 25 名,就能通过检验。
单尾还是双尾。 问毕业生是否挣得更多,就把整个 5% 都放在一侧的尾部。问他们的收入是否不同,不论高低,就要把 5% 分到两侧尾部,这会让 p 值翻倍到 0.38,检验也就更难通过。