2025 · Studies学习笔记
Confidence Intervals, by Formula and by Resampling置信区间:用公式算,也用重抽样算
Two ways to put a range around an estimate. One uses the t-distribution, the other resamples the data you already have. Both are built and plotted step by step, along with what a 95% interval does and doesn't promise.给一个估计值加上范围的两种方法。一种用 t 分布,另一种对手头已有的数据重新抽样。两种方法都一步步搭建并画图展示,同时说明 95% 的区间能保证什么、不能保证什么。
A single sample mean is a guess. A confidence interval says how far off that guess could reasonably be. This study builds intervals two ways and plots each one.
By formula. The classic interval is the sample mean plus or minus a t value times the standard error, s/√n. Plots of repeated samples show the two things that narrow it, a bigger sample and less spread in the data. Drawing 40 values at a time from a skewed, salary-like population, the t-interval still works, because the average of 40 values is close to normal even when the values aren’t.
By resampling. The bootstrap needs no formula. Draw a new sample of the same size from your own data with replacement, take its mean, repeat a thousand times, and keep the middle 95% of those means. The study walks through it on a sample of only ten salaries, where assuming a normal shape is hardest to justify.
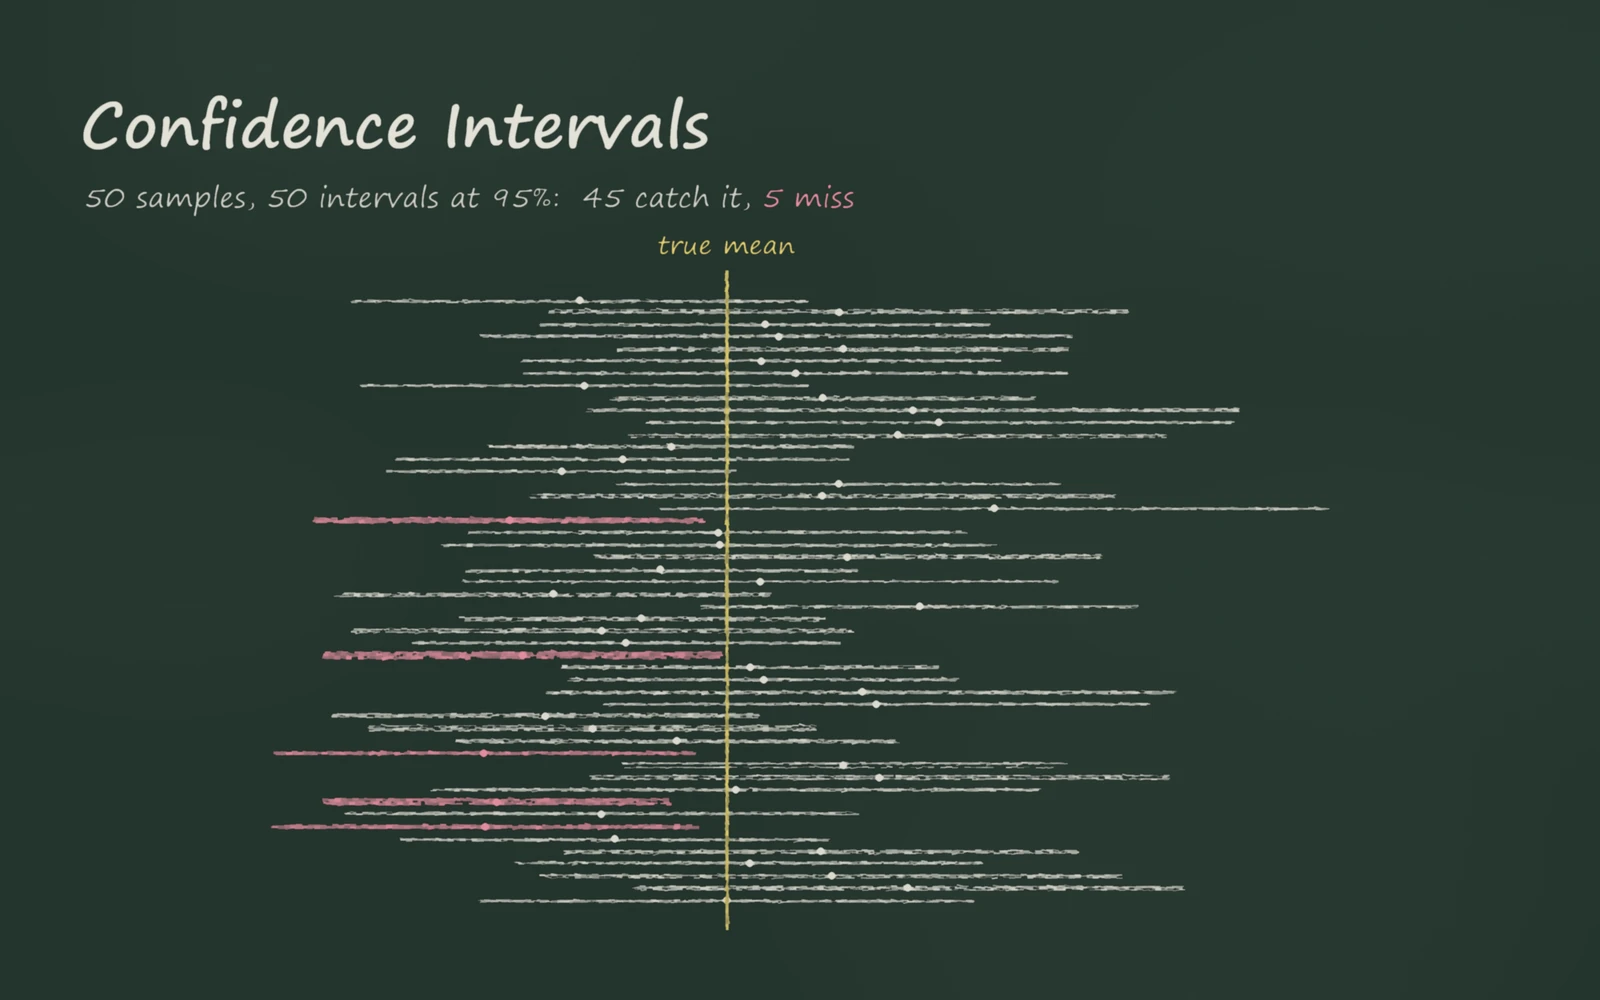
What 95% means. The cover shows the idea most people get wrong. Fifty samples give fifty intervals, and 45 of them catch the true mean. Over 10,000 repeats the same procedure caught it 94.9% of the time. The 95% belongs to the method, not to any one interval, which either contains the true mean or doesn’t. The cover also shows a quieter effect of skew. All five misses fall on the low side, because a sample from a long-tailed population usually misses the rare high values.
The study ends with the common misreadings, such as treating the interval as the range where 95% of the data falls, or reading a wider interval as a more accurate one.
单个样本均值只是一个猜测。置信区间告诉你,这个猜测合理地可能偏差多少。这个研究用两种方法构造区间,并分别画图展示。
用公式算。 经典的区间是样本均值加减一个 t 值乘以标准误 s/√n。对重复抽样的结果画图,可以看到让区间变窄的两个因素:样本更大,以及数据本身更集中。从一个偏态的、类似工资分布的总体中每次抽 40 个值,t 区间依然有效,因为即使单个数值不服从正态分布,40 个值的平均数也接近正态分布。
用重抽样算。 自助法(bootstrap)不需要任何公式。从你自己的数据中有放回地抽出一个同样大小的新样本,算出它的均值,重复一千次,然后取这些均值中间的 95%。研究用一个只有十个工资数据的样本来演示,这正是最难假设数据呈正态分布的情况。
95% 是什么意思。 封面图展示的是大多数人会理解错的地方。五十个样本得到五十个区间,其中 45 个包含了真实均值。重复 10,000 次,同样的方法有 94.9% 的时候包含了真实均值。95% 说的是这个方法,而不是某一个具体的区间,一个具体的区间要么包含真实均值,要么不包含。封面图还展示了偏态带来的一个不太显眼的影响:五次没包含真实均值的情况全都偏低,因为从长尾总体中抽出的样本,通常会漏掉那些少见的高值。
研究最后列出了常见的误解,比如把区间当成 95% 的数据所在的范围,或者认为区间越宽就越准确。