Projects & Research
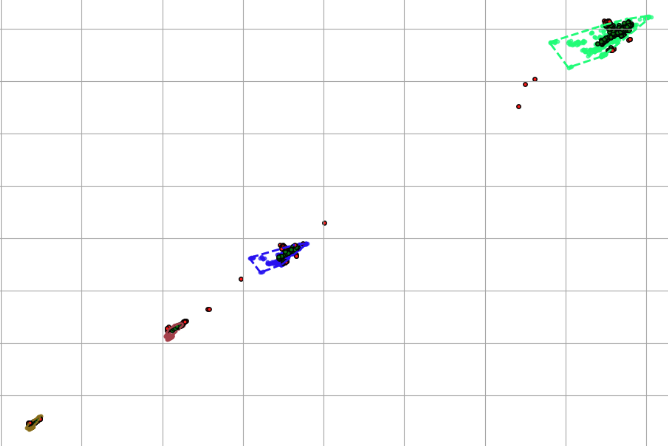
Voltage Anomaly Detection (Schneider Electric)
Conducted a large-scale statistical analysis of voltage behavior across 200+ corporations to define normal operating ranges. Applied feature engineering, unsupervised learning algorithms (GMM, DBSCAN, K-Means, PCA), and developed a fully automated, scalable ML pipeline using Python (OOP) for anomaly detection and voltage profiling.
The solution optimized operational efficiency, reduced costs, and enabled automated technician dispatch through intelligent voltage anomaly identification.
Note: Project details are protected under NDA and not open-sourced.
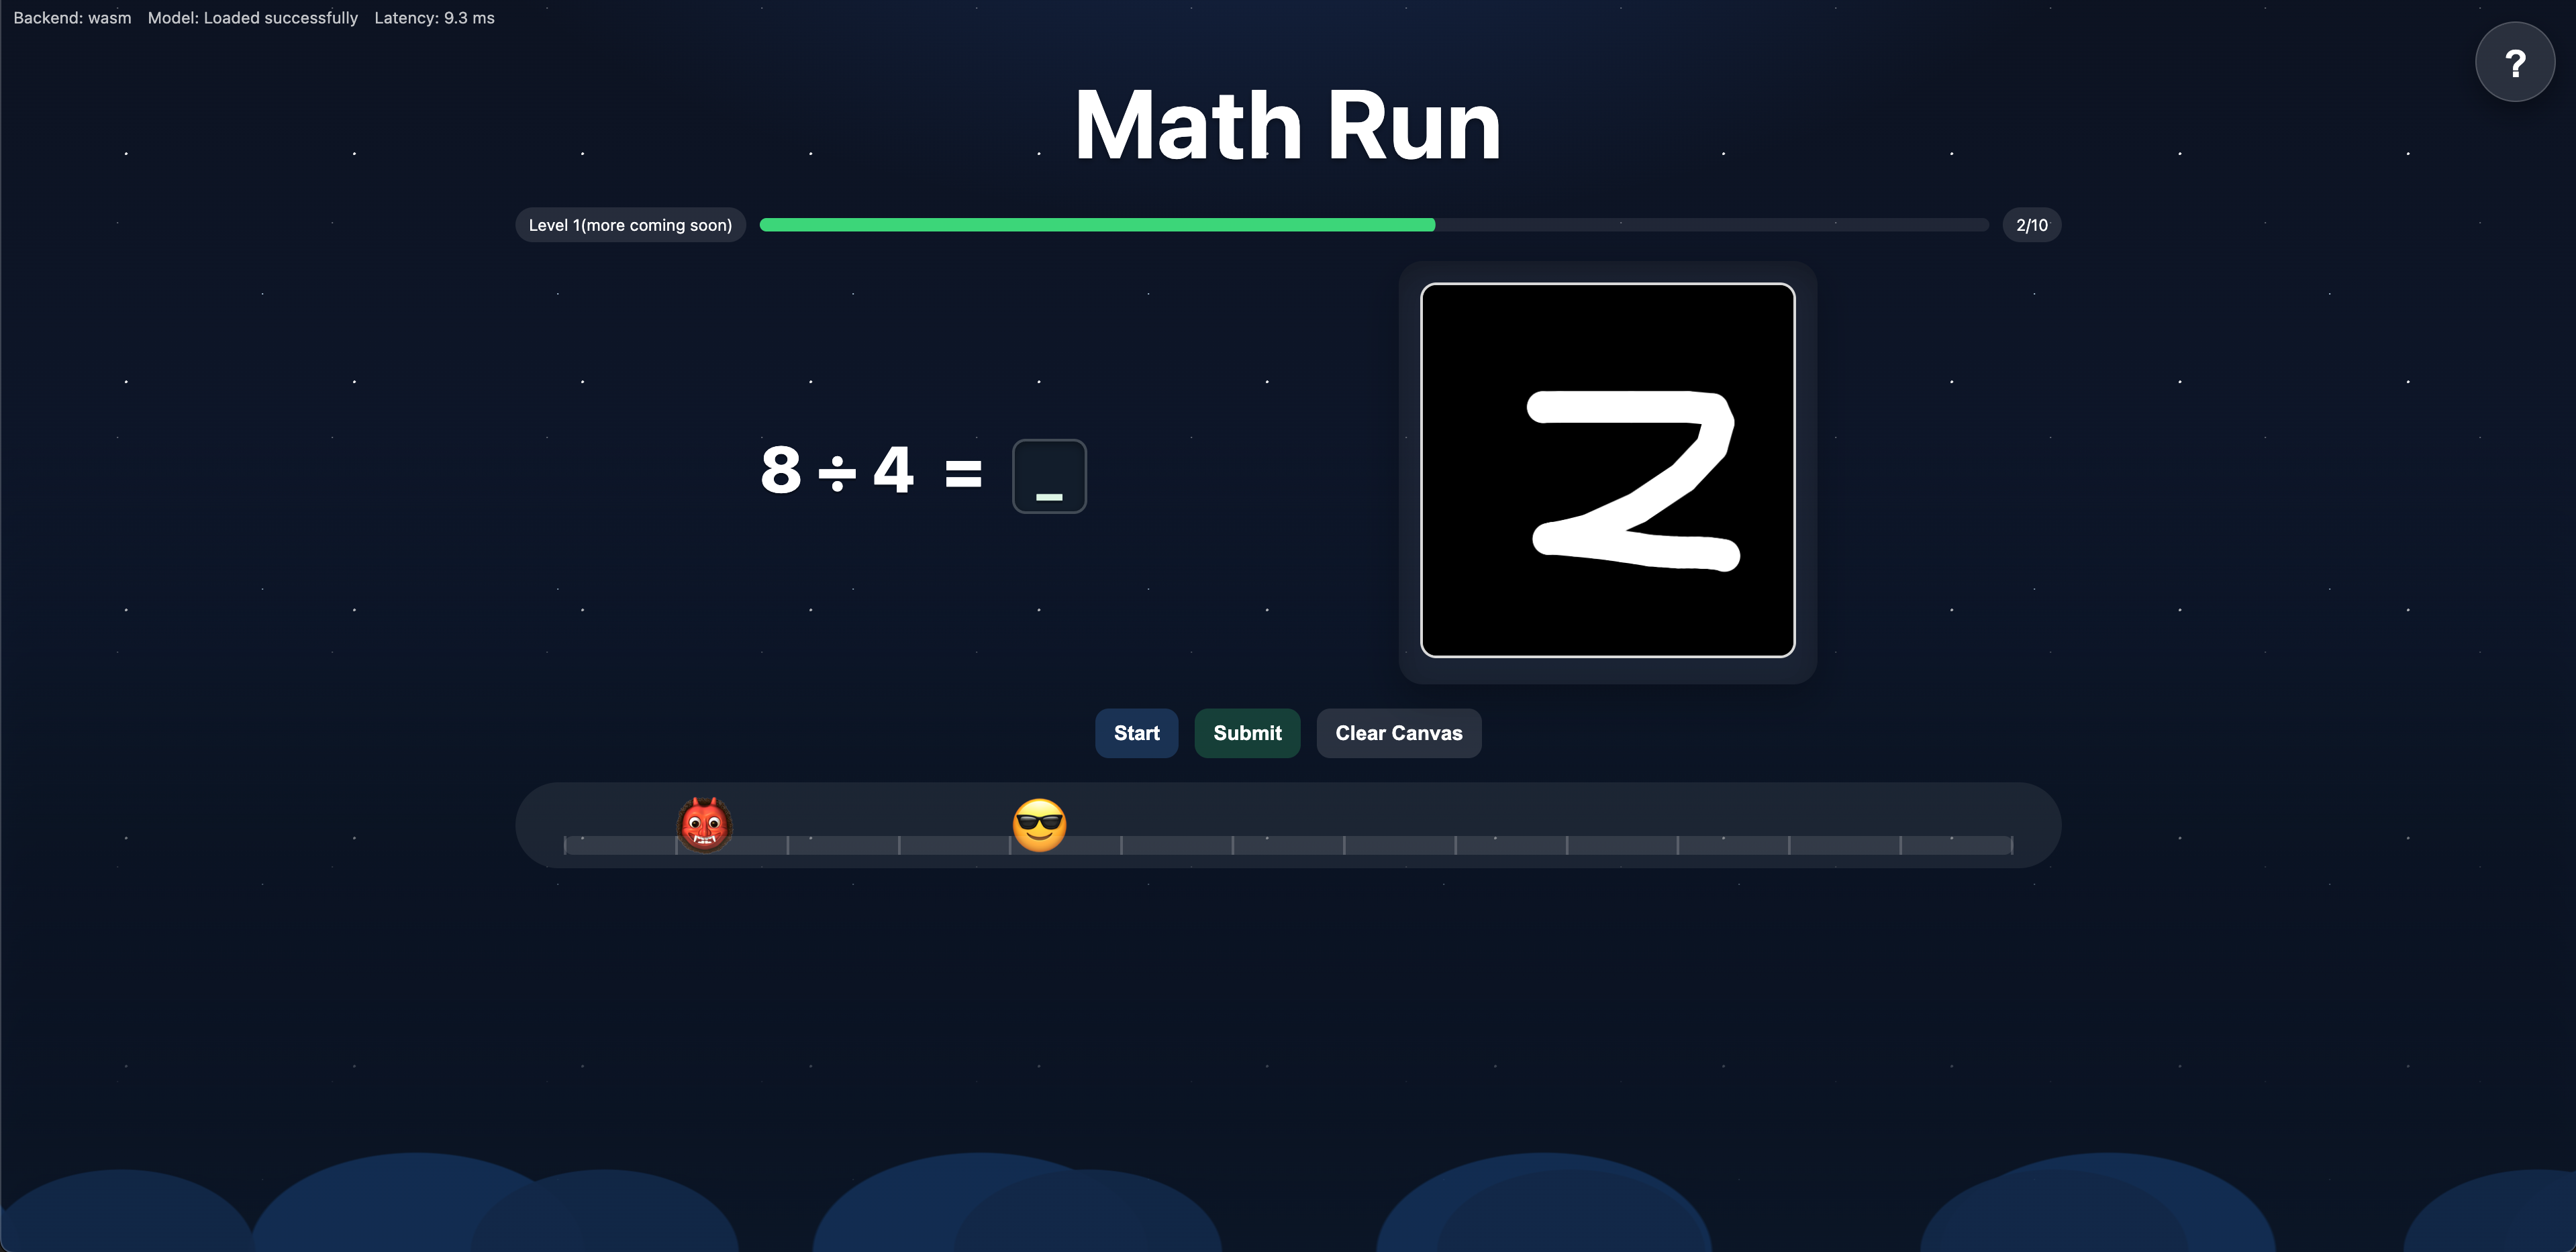
Math Run
A portfolio project combining web development and deep learning into an interactive browser game. Inspired by Temple Run, Math Run challenges players to escape a monster 👹 by handwriting digits (0–9) as answers to quick math problems. A custom client-side preprocessing pipeline (grayscale conversion, Otsu thresholding, connected component extraction, resizing, centroid alignment) ensures clean digit inputs, which are then recognized by a TensorFlow.js-deployed MLP model trained on MNIST (~98% accuracy). This project demonstrates real-time inference, fully in-browser, without any backend support.
View on GitHub Play the Game Here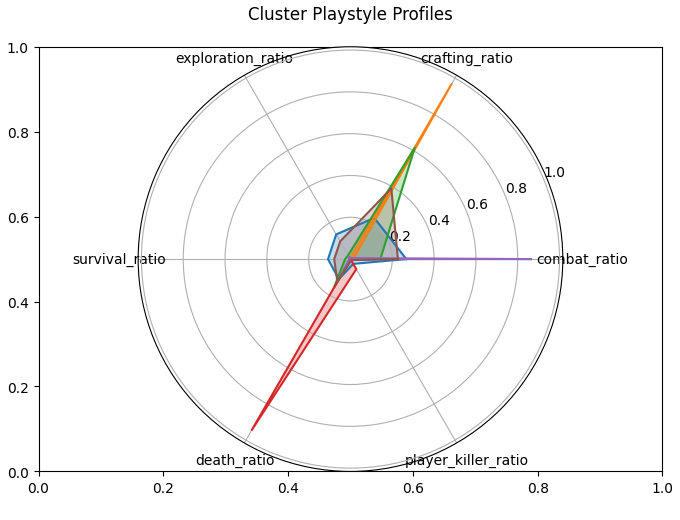
Steam Game Player Insight
A personal research project applying data science and machine learning to Steam player data. Starting with 7 Days to Die, Regression models are built to analyze and predict achievement efficiency (Polynomial R²≈0.96, Random Forest R²≈0.90), identified distinct player segmentation through clustering (generalists, crafters, explorers, fighters, early quitters), and A/B testing demonstrated that multiplayer engagement significantly boosts playtime.
This research showcases how data-driven methods can reveal retention risks, inform content design, and even support anomaly or cheater detection. Future work will expand to other Steam titles and explore sequential modeling of achievement unlocks with RNNs.
View on GitHub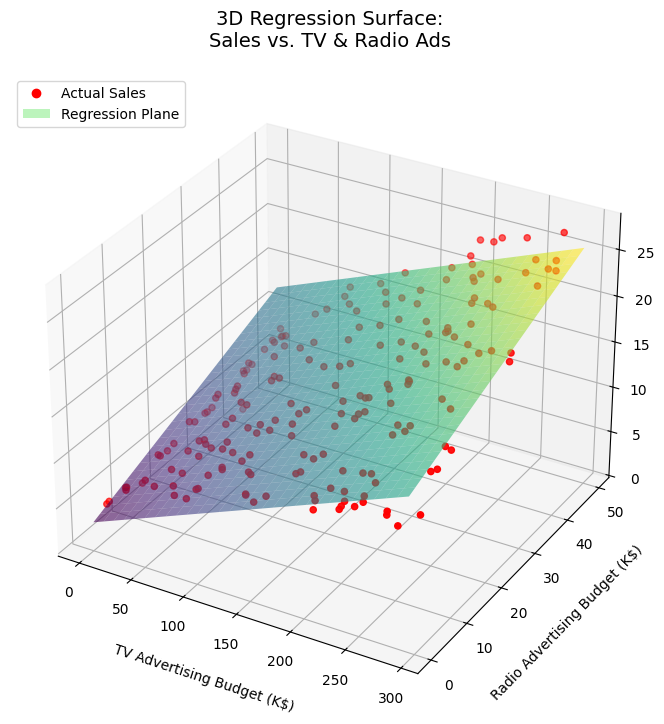
Linear Regression Case Study
A hands-on case study exploring Simple and Multiple Linear Regression to predict product sales based on advertising budgets across TV, Radio, and Newspaper. Key contributions include manual implementation of OLS and Gradient Descent, hypothesis testing, confidence interval analysis, and interaction effect modeling—emphasizing both theoretical foundations and statistical interpretability using Python.
View on GitHub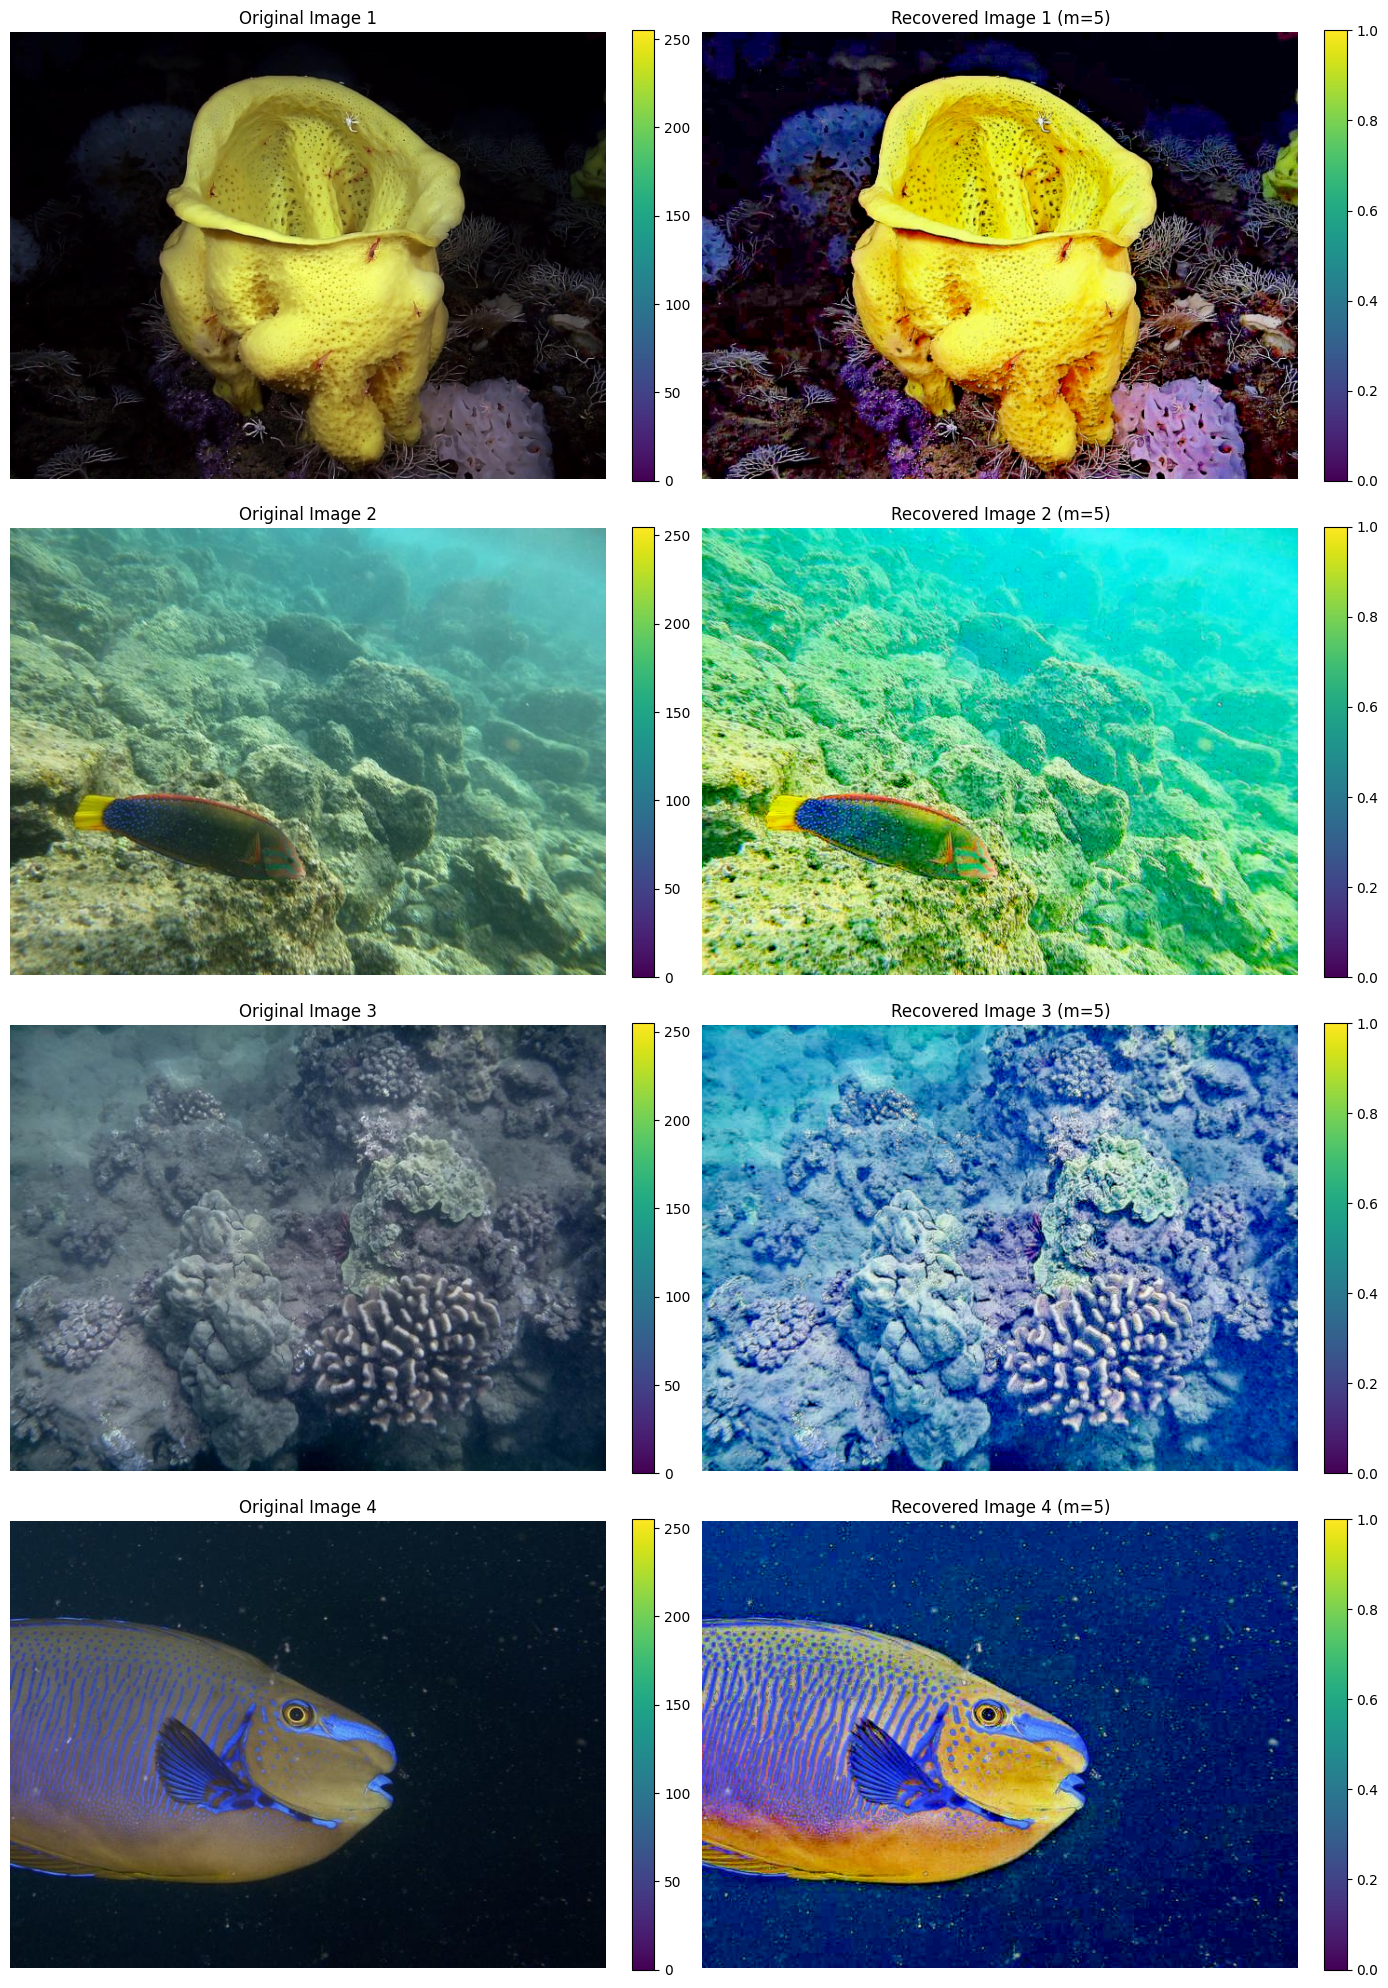
Underwater Image Enhancement (L²UWE Reimplementation)
This project reimplements the L²UWE pipeline—an efficient framework for enhancing low-light underwater images using local contrast and multi-scale fusion—originally proposed by Tunai Porto Marques and Professor Alexandra Branzan Albu at the University of Victoria. Under Professor Albu’s supervision, I reproduced this work in 2023 using Python, OpenCV, NumPy, and Matplotlib, faithfully following the methodology described in the original paper. The pipeline includes local contrast estimation, dark channel refinement, radiance recovery, and multi-scale Laplacian pyramid fusion, all designed from scratch with a strong emphasis on code clarity and educational visualization. Unlike black-box deep learning models, L²UWE is grounded in physical intuition and image formation theory, making it interpretable and efficient. The implementation is applicable to marine ecology, underwater robotics, archaeological preservation, and submerged infrastructure inspection, and it significantly deepened my understanding of image enhancement theory and underwater visual processing.
View on GitHub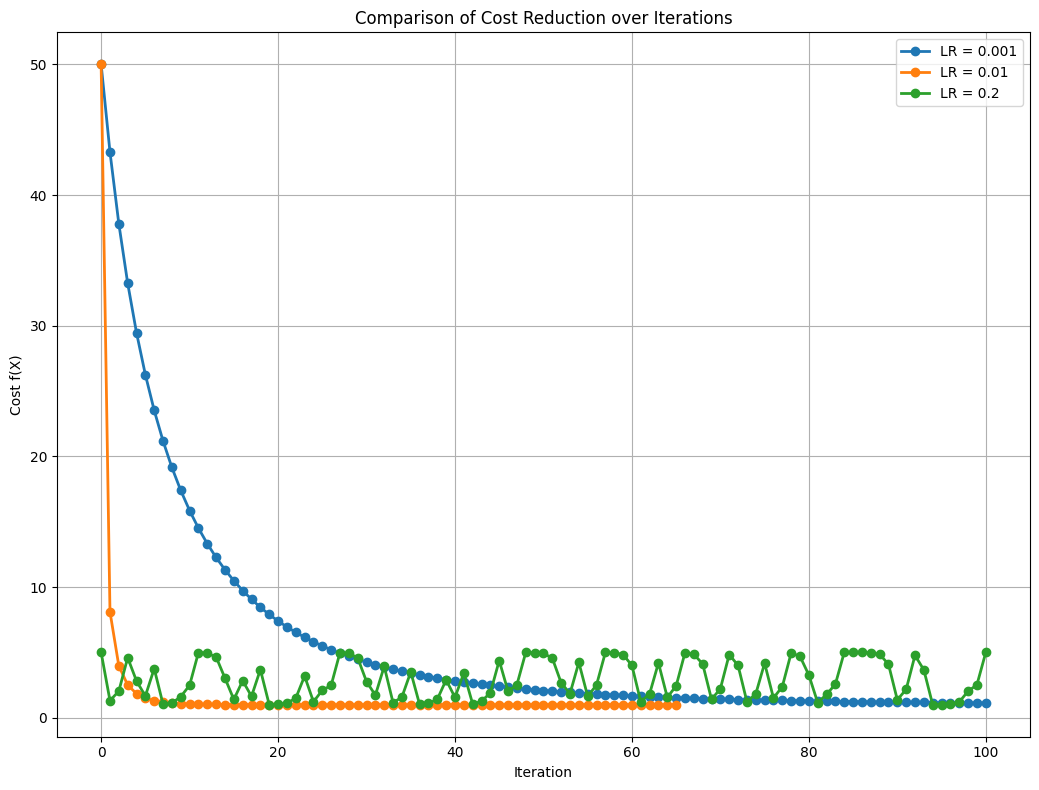
Gradient Descent: Insights into Behavior and Optimization Challenges
Manually implemented and visualized gradient descent optimization paths across various cost functions to investigate convergence behaviors under different initialization strategies and learning rates. Explored phenomena like slow convergence, divergence, oscillations, and local minima through a series of four structured case studies.
This project highlights practical limitations of gradient-based optimization and provides valuable insights for debugging, hyperparameter tuning, and model optimization in machine learning workflows.
Confidence Interval Studies
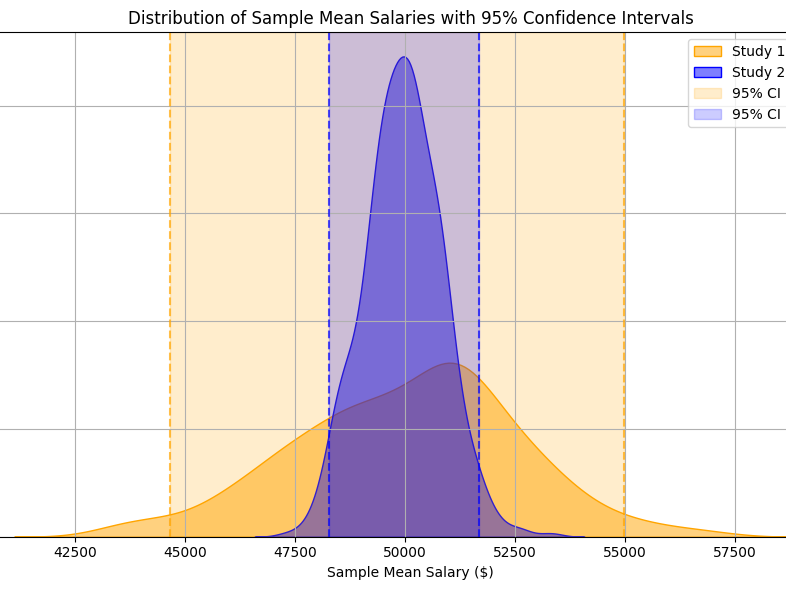
Designed and visualized both parametric (t-distribution) and non-parametric (bootstrap) confidence intervals to demonstrate how we estimate uncertainty in statistical analysis. This project clarifies what Confidence Interval really mean, how they’re constructed, and debunks common misinterpretations—all through hands-on simulations and intuitive visual guides.
View on GitHub
Hypothesis Testing Studies
A comprehensive, step-by-step exploration of core statistical inference concepts—null vs. alternative hypotheses, p-values, significance levels, and critical values—paired with a deep dive into one-tailed vs. two-tailed tests. Through detailed markdown notes, custom visual illustrations, and runnable Jupyter notebooks (with a simulated dataset), this project helps students, data practitioners, and interview-prep learners build strong intuition and hands-on skills in hypothesis testing.
View on GitHub